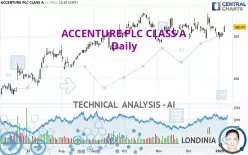
ACCENTURE PLC CLASS A - Daily - Technical analysis published on 01/07/2025 (GMT)
- 130
- 0
Click here for a new analysis!
- Timeframe : Daily
- - Analysis generated on
- Status : TARGET REACHED

Summary of the analysis

Additional analysis
Quotes
ACCENTURE PLC CLASS A rating 360.96 USD. On the day, this instrument gained +2.74% with the lowest point at 354.98 USD and the highest point at 363.22 USD. The deviation from the price is +1.68% for the low point and -0.62% for the high point.The Central Gaps scanner detects a bullish gap which is a sign that buyers have taken the lead in the very short term.
Opening Gap UP
Type : Bullish
Timeframe : Openning
A study of price movements over other periods shows the following variations:
Near a new LOW record (1st january)
Type : Bearish
Timeframe : Weekly
Near a new LOW record (1 month)
Type : Bearish
Timeframe : Weekly
Technical
Technical analysis of this Daily chart of ACCENTURE PLC CLASS A indicates that the overall trend is bullish. 71.43% of the signals given by moving averages are bullish. This bullish trend shows slight signs of slowing down given the slightly bullish signals given by the short-term moving averages. The Central Indicators scanner detects bullish signals on moving averages that could impact this trend:
Bullish price crossover with Moving Average 20
Type : Bullish
Timeframe : Daily
Bullish price crossover with Moving Average 50
Type : Bullish
Timeframe : Daily
Bullish price crossover with Moving Average 100
Type : Bullish
Timeframe : Daily
Bullish price crossover with adaptative moving average 20
Type : Bullish
Timeframe : Daily
Bullish price crossover with adaptative moving average 50
Type : Bullish
Timeframe : Daily
Bullish price crossover with adaptative moving average 100
Type : Bullish
Timeframe : Daily
Technical indicators are bearish. There is still some doubt about the decline in the price.
Central Indicators, the detector scanner for these technical indicators has recently detected several signals:
Pivot points : price is over resistance 1
Type : Neutral
Timeframe : Weekly
Pivot points : price is over resistance 3
Type : Neutral
Timeframe : Daily
RSI indicator is back over 50
Type : Bullish
Timeframe : Daily
Ichimoku : price is over the cloud
Type : Bullish
Timeframe : Daily
Momentum indicator is back over 0
Type : Bullish
Timeframe : Daily
Central Patterns, the market scanner focusing on chart patterns, resistances and supports found these results:
Near horizontal support
Type : Bullish
Timeframe : Daily
Near support of channel
Type : Bullish
Timeframe : Daily
No result was found by the Central Candlesticks scanner on Japanese candlesticks.
| S3 | S2 | S1 | Price | R1 | R2 | |
|---|---|---|---|---|---|---|
| ProTrendLines | 329.90 | 343.90 | 356.47 | 360.96 | 382.14 | 400.19 |
| Change (%) | -8.60% | -4.73% | -1.24% | - | +5.87% | +10.87% |
| Change | -31.06 | -17.06 | -4.49 | - | +21.18 | +39.23 |
| Level | Intermediate | Minor | Major | - | Major | Major |
Pivot points can also be used to set your price objectives. Here is the price situation in relation to pivot points:
| Pivot points | S3 | S2 | S1 | PP | R1 | R2 | R3 |
|---|---|---|---|---|---|---|---|
| Standard | 344.32 | 346.98 | 349.16 | 351.82 | 354.00 | 356.66 | 358.84 |
| Camarilla | 350.00 | 350.44 | 350.89 | 351.33 | 351.77 | 352.22 | 352.66 |
| Woodie | 344.07 | 346.86 | 348.91 | 351.70 | 353.75 | 356.54 | 358.59 |
| Fibonacci | 346.98 | 348.83 | 349.97 | 351.82 | 353.67 | 354.81 | 356.66 |
| Pivot points | S3 | S2 | S1 | PP | R1 | R2 | R3 |
|---|---|---|---|---|---|---|---|
| Standard | 339.31 | 342.71 | 348.28 | 351.68 | 357.25 | 360.65 | 366.22 |
| Camarilla | 351.38 | 352.21 | 353.03 | 353.85 | 354.67 | 355.50 | 356.32 |
| Woodie | 340.40 | 343.25 | 349.37 | 352.22 | 358.34 | 361.19 | 367.31 |
| Fibonacci | 342.71 | 346.14 | 348.25 | 351.68 | 355.11 | 357.22 | 360.65 |
| Pivot points | S3 | S2 | S1 | PP | R1 | R2 | R3 |
|---|---|---|---|---|---|---|---|
| Standard | 309.68 | 328.15 | 339.97 | 358.44 | 370.26 | 388.73 | 400.55 |
| Camarilla | 343.46 | 346.24 | 349.01 | 351.79 | 354.57 | 357.34 | 360.12 |
| Woodie | 306.36 | 326.49 | 336.65 | 356.78 | 366.94 | 387.07 | 397.23 |
| Fibonacci | 328.15 | 339.72 | 346.87 | 358.44 | 370.01 | 377.16 | 388.73 |
Numerical data
The following is the status of the technical indicators and moving averages at the time of publication of this technical analysis:
| RSI (14): | 44.73 | |
| MACD (12,26,9): | -1.8400 | |
| Directional Movement: | -10.01 | |
| AROON (14): | -57.14 | |
| DEMA (21): | 354.78 | |
| Parabolic SAR (0,02-0,02-0,2): | 373.49 | |
| Elder Ray (13): | -3.45 | |
| Super Trend (3,10): | 343.92 | |
| Zig ZAG (10): | 351.33 | |
| VORTEX (21): | 0.8300 | |
| Stochastique (14,3,5): | 16.96 | |
| TEMA (21): | 352.62 | |
| Williams %R (14): | -83.05 | |
| Chande Momentum Oscillator (20): | -5.97 | |
| Repulse (5,40,3): | -0.6100 | |
| ROCnROLL: | 2 | |
| TRIX (15,9): | -0.0300 | |
| Courbe Coppock: | 2.84 |
| MA7: | 353.56 | |
| MA20: | 358.20 | |
| MA50: | 357.62 | |
| MA100: | 352.42 | |
| MAexp7: | 353.60 | |
| MAexp20: | 356.65 | |
| MAexp50: | 356.48 | |
| MAexp100: | 351.03 | |
| Price / MA7: | +2.09% | |
| Price / MA20: | +0.77% | |
| Price / MA50: | +0.93% | |
| Price / MA100: | +2.42% | |
| Price / MAexp7: | +2.08% | |
| Price / MAexp20: | +1.21% | |
| Price / MAexp50: | +1.26% | |
| Price / MAexp100: | +2.83% |
News
Don't forget to follow the news on ACCENTURE PLC CLASS A. At the time of publication of this analysis, the latest news was as follows:
- Accenture Technology Vision 2025: New Age of AI to Bring Unprecedented Autonomy to Business
- Accenture Launches AI Refinery for Industry to Reinvent Processes and Accelerate Agentic AI Journeys
- Accenture Reports First-Quarter Fiscal 2025 Results
- Accenture to Acquire IQT Group, Strengthening Its Capabilities for Net-Zero Infrastructure Projects
- Accenture Launches On-Demand Gen AI Learning Program, Powered by Content from Stanford Online
About author
Online


Add a comment
Comments
0 comments on the analysis ACCENTURE PLC CLASS A - Daily