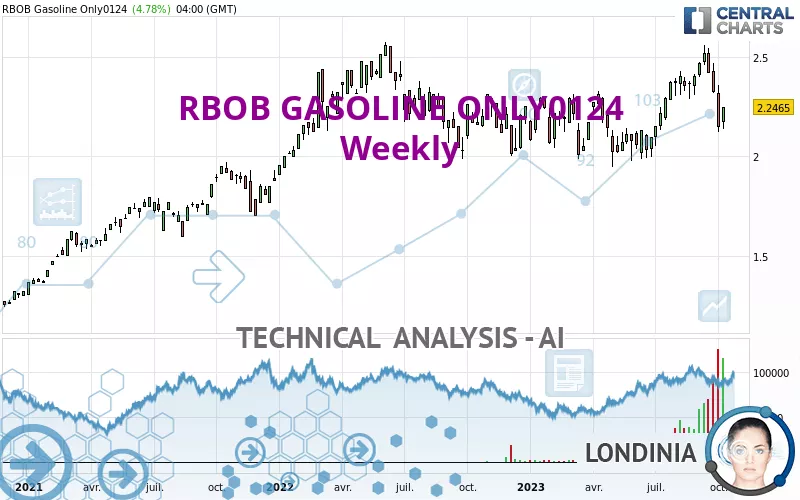
RBOB GASOLINE ONLY0124 - Weekly - Technical analysis published on 10/14/2023 (GMT)
- 92
- 0
Click here for a new analysis!
- Timeframe : Weekly
- - Analysis generated on
- Status : INVALID

Summary of the analysis
Additional analysis
Quotes
The RBOB GASOLINE ONLY0124 price is 2.2465 USD. The price registered an increase of +4.62% over 5 days and has been traded over the last 5 days between 2.1359 USD and 2.2492 USD. This implies that the 5 day price is +5.18% from its lowest point and -0.12% from its highest point.A bullish opening was detected by the Central Gaps scanner. Buyers are trying to impose a bullish momentum in the very short term.
Bullish opening
Type : Bullish
Timeframe : Openning
Here is a more detailed summary of the historical variations registered by RBOB GASOLINE ONLY0124:
Near a new LOW record (1 month)
Type : Bearish
Timeframe : Weekly
The Central Volumes scanner notes the presence of abnormal volumes:
Abnormal volumes
Timeframe : 5 days
Abnormal volumes
Timeframe : 20 days
Abnormal volumes
Timeframe : 50 days
Technical
Technical analysis of this Weekly chart of RBOB GASOLINE ONLY0124 indicates that the overall trend is bullish. 75.00% of the signals given by moving averages are bullish. Caution: the neutral signals currently given by short-term moving averages show us that the global trend is losing momentum. The Central Indicators market scanner is currently detecting several bearish and bullish signals that could impact this trend:
Bearish trend reversal : adaptative moving average 20
Type : Bearish
Timeframe : Weekly
Bullish price crossover with Moving Average 50
Type : Bullish
Timeframe : Weekly
Bullish price crossover with Moving Average 100
Type : Bullish
Timeframe : Weekly
Bullish price crossover with adaptative moving average 50
Type : Bullish
Timeframe : Weekly
Bullish price crossover with adaptative moving average 100
Type : Bullish
Timeframe : Weekly
An assessment of technical indicators does not currently provide any relevant information to suggest whether the signal given by the technical indicators is more bullish or bearish.
Central Indicators, the detector scanner for these technical indicators recently detected a signal:
Price is back over the pivot point
Type : Bullish
Timeframe : Weekly
Central Patterns, the scanner specializing in chart patterns, did not identify any signals.
The presence of a bullish Japanese candlestick pattern detected by Central Candlesticks that could cause a very short term rebound was also detected:
Bullish harami
Type : Bullish
Timeframe : Weekly
| S3 | S2 | S1 | Price | R1 | R2 | |
|---|---|---|---|---|---|---|
| ProTrendLines | 1.6999 | 1.9951 | 2.1735 | 2.2465 | 2.3207 | 2.5739 |
| Change (%) | -24.33% | -11.19% | -3.25% | - | +3.30% | +14.57% |
| Change | -0.5466 | -0.2514 | -0.0730 | - | +0.0742 | +0.3274 |
| Level | Minor | Major | Major | - | Major | Major |
Attention could also be paid to pivot points to set price objectives:
| Pivot points | S3 | S2 | S1 | PP | R1 | R2 | R3 |
|---|---|---|---|---|---|---|---|
| Standard | 2.0554 | 2.0957 | 2.1198 | 2.1601 | 2.1842 | 2.2245 | 2.2486 |
| Camarilla | 2.1263 | 2.1322 | 2.1381 | 2.1440 | 2.1499 | 2.1558 | 2.1617 |
| Woodie | 2.0474 | 2.0917 | 2.1118 | 2.1561 | 2.1762 | 2.2205 | 2.2406 |
| Fibonacci | 2.0957 | 2.1203 | 2.1355 | 2.1601 | 2.1847 | 2.1999 | 2.2245 |
| Pivot points | S3 | S2 | S1 | PP | R1 | R2 | R3 |
|---|---|---|---|---|---|---|---|
| Standard | 1.8225 | 1.9719 | 2.0596 | 2.2090 | 2.2967 | 2.4461 | 2.5338 |
| Camarilla | 2.0822 | 2.1039 | 2.1257 | 2.1474 | 2.1691 | 2.1909 | 2.2126 |
| Woodie | 1.7918 | 1.9565 | 2.0289 | 2.1936 | 2.2660 | 2.4307 | 2.5031 |
| Fibonacci | 1.9719 | 2.0624 | 2.1184 | 2.2090 | 2.2995 | 2.3555 | 2.4461 |
| Pivot points | S3 | S2 | S1 | PP | R1 | R2 | R3 |
|---|---|---|---|---|---|---|---|
| Standard | 2.0053 | 2.1622 | 2.2429 | 2.3998 | 2.4805 | 2.6374 | 2.7181 |
| Camarilla | 2.2584 | 2.2801 | 2.3019 | 2.3237 | 2.3455 | 2.3673 | 2.3890 |
| Woodie | 1.9673 | 2.1432 | 2.2049 | 2.3808 | 2.4425 | 2.6184 | 2.6801 |
| Fibonacci | 2.1622 | 2.2529 | 2.3090 | 2.3998 | 2.4905 | 2.5466 | 2.6374 |
Numerical data
The following are the details of the technical indicators and moving averages that were collected to generate this technical analysis:
| RSI (14): | 48.64 | |
| MACD (12,26,9): | 0.0391 | |
| Directional Movement: | -7.6518 | |
| AROON (14): | 71.4286 | |
| DEMA (21): | 2.3434 | |
| Parabolic SAR (0,02-0,02-0,2): | 2.5479 | |
| Elder Ray (13): | -0.1175 | |
| Super Trend (3,10): | 2.5591 | |
| Zig ZAG (10): | 2.2447 | |
| VORTEX (21): | 1.0349 | |
| Stochastique (14,3,5): | 35.39 | |
| TEMA (21): | 2.3627 | |
| Williams %R (14): | -71.64 | |
| Chande Momentum Oscillator (20): | -0.0501 | |
| Repulse (5,40,3): | -5.6631 | |
| ROCnROLL: | -1 | |
| TRIX (15,9): | 0.3538 | |
| Courbe Coppock: | 18.77 |
| MA7: | 2.1822 | |
| MA20: | 2.3197 | |
| MA50: | 2.3676 | |
| MA100: | 2.2628 | |
| MAexp7: | 2.3086 | |
| MAexp20: | 2.2892 | |
| MAexp50: | 2.2308 | |
| MAexp100: | 2.1146 | |
| Price / MA7: | +2.95% | |
| Price / MA20: | -3.16% | |
| Price / MA50: | -5.11% | |
| Price / MA100: | -0.72% | |
| Price / MAexp7: | -2.69% | |
| Price / MAexp20: | -1.87% | |
| Price / MAexp50: | +0.70% | |
| Price / MAexp100: | +6.24% |
About author

Online


Add a comment
Comments
0 comments on the analysis RBOB GASOLINE ONLY0124 - Weekly