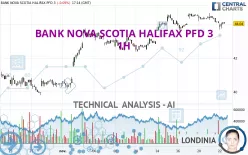
BANK NOVA SCOTIA HALIFAX PFD 3
24.96
USD
(-2.46%)
03/28/2025 - 19:59
Closed 15 min delayed data - NYSE Stocks
| Open: | 25.42 |
| Change: | -0.63 |
| Volume: | 380,223 |
| Low: | 24.70 |
| High: | 25.50 |
| High / Low range: | 0.80 |
| Type: | Stocks |
| Ticker: | BNS |
| ISIN: | CA0641491075 |
BANK NOVA SCOTIA HALIFAX PFD 3 - 1H - Technical analysis published on 11/22/2023 (GMT)
- 122
- 0
- 11/22/2023 - 17:30
Oops, I was wrong about that analysis. My threshold for invalidation has been broken.
Click here for a new analysis!
Click here for a new analysis!
- Timeframe : 1H
- - Analysis generated on 11/22/2023 - 17:30
- Status : INVALID

Summary of the analysis
Trends
Short term:
Bearish
Underlying:
Bullish
Technical indicators
28%
44%
28%
My opinion
Bullish above 43.75 USD
My targets
44.64 USD (+1.29%)
45.71 USD (+3.72%)
My analysis
With a bullish background trend, the price of BANK NOVA SCOTIA HALIFAX PFD 3 is trying to inflate a little with a slight short-term relapse. At this stage, no trend reversal is in sight. Globally, buyers have the upper hand. Traders could allow themselves to trade long positions (at the time of purchase) as long as the price remains above the support located at 43.75 USD. A bullish break in the resistance located at 44.64 USD would boost the bullish momentum and fuel the basic trend. Then the price could move towards 45.71 USD. Then 48.39 USD by extension. It would be safer to wait for a bullish break in the resistance located at 44.64 USD before allowing yourself to re trade long positions (at purchase) on BANK NOVA SCOTIA HALIFAX PFD 3. PS: if there is a bearish break in the support located at 43.75 USD we suggest that you produce a new automated technical analysis. In fact, conditions should have changed. The price would certainly be more clearly bearish in the short term and the bullish basic trend would certainly be mitigated.
In the very short term, the general bullish sentiment is not called into question, despite technical indicators being indecisive.
Force
0
10
0.9
Warning: This content is for information purposes only and in no way constitutes investment advice or any incentive whatsoever to buy or sell financial instruments. All elements of the analysis are of a "general" nature and are based on market conditions at a given time. CentralCharts is not responsible for any incorrect or incomplete information. Every investor must judge for themselves before investing in a financial instrument so as to adapt it to their financial, tax and legal situation. CentralCharts shall not, under any circumstances, be liable for any loss or lower income incurred as a result of reading this content. Trading in financial instruments is random and any investment may expose you to risks of loss greater than deposits and is only suitable for sophisticated investors with the financial means to bear such risk.

This analysis was given by Londinia. Take part yourself by sharing additional analysis on another time unit:
Additional analysis
Quotes
The BANK NOVA SCOTIA HALIFAX PFD 3 rating is 44.07 USD. The price is lower by -0.02% since the last closing with the lowest point at 43.69 USD and the highest point at 44.14 USD. The deviation from the price is +0.87% for the low point and -0.16% for the high point.43.69
44.14
44.07
The Central Gaps scanner detects the formation of a bearish gap marking the strong presence of sellers ahead of buyers at the opening. This formed a quotation gap.
Opening Gap DOWN
Type : Bearish
Timeframe : Openning
So that you have an overall view of the price change, here is a table showing the variations over several periods:
Near a new HIGH record (1 month)
Type : Bullish
Timeframe : Weekly
Technical
Technical analysis of this 1H chart of BANK NOVA SCOTIA HALIFAX PFD 3 indicates that the overall trend is bullish. 67.86% of the signals given by moving averages are bullish. Caution: the current slightly bearish signals from short-term moving averages indicate that the overall trend may be slowing down. There is no crossing of moving average by the price or crossing of moving averages between themselves.
An assessment of technical indicators does not currently provide any relevant information to suggest whether the signal given by the technical indicators is more bullish or bearish.
The Central Indicators scanner specialised in technical indicators, has not detected anything further.
An analysis of the price chart with the Central Patterns scanner (detector of chart patterns and resistances and supports) shows a result that can have an impact on the price change:
Near support of channel
Type : Bullish
Timeframe : 1 hour
No result was found by the Central Candlesticks scanner on Japanese candlesticks.
ProTrendLines
S3
S2
S1
R1
R2
R3
Price
| S3 | S2 | S1 | Price | R1 | R2 | R3 | |
|---|---|---|---|---|---|---|---|
| ProTrendLines | 40.76 | 42.44 | 43.75 | 44.07 | 44.23 | 44.64 | 45.71 |
| Change (%) | -7.51% | -3.70% | -0.73% | - | +0.36% | +1.29% | +3.72% |
| Change | -3.31 | -1.63 | -0.32 | - | +0.16 | +0.57 | +1.64 |
| Level | Minor | Intermediate | Intermediate | - | Intermediate | Minor | Major |
To determine price objectives, it is also possible to use the pivot points. Here is the price position in relation to pivot points:
Daily
| Pivot points | S3 | S2 | S1 | PP | R1 | R2 | R3 |
|---|---|---|---|---|---|---|---|
| Standard | 43.26 | 43.66 | 43.87 | 44.27 | 44.48 | 44.88 | 45.09 |
| Camarilla | 43.91 | 43.97 | 44.02 | 44.08 | 44.14 | 44.19 | 44.25 |
| Woodie | 43.17 | 43.61 | 43.78 | 44.22 | 44.39 | 44.83 | 45.00 |
| Fibonacci | 43.66 | 43.89 | 44.04 | 44.27 | 44.50 | 44.65 | 44.88 |
Weekly
| Pivot points | S3 | S2 | S1 | PP | R1 | R2 | R3 |
|---|---|---|---|---|---|---|---|
| Standard | 40.99 | 41.75 | 43.14 | 43.90 | 45.29 | 46.05 | 47.44 |
| Camarilla | 43.95 | 44.15 | 44.34 | 44.54 | 44.74 | 44.93 | 45.13 |
| Woodie | 41.32 | 41.91 | 43.47 | 44.06 | 45.62 | 46.21 | 47.77 |
| Fibonacci | 41.75 | 42.57 | 43.08 | 43.90 | 44.72 | 45.23 | 46.05 |
Monthly
| Pivot points | S3 | S2 | S1 | PP | R1 | R2 | R3 |
|---|---|---|---|---|---|---|---|
| Standard | 33.40 | 36.60 | 38.53 | 41.73 | 43.66 | 46.86 | 48.79 |
| Camarilla | 39.06 | 39.53 | 40.00 | 40.47 | 40.94 | 41.41 | 41.88 |
| Woodie | 32.78 | 36.28 | 37.91 | 41.41 | 43.04 | 46.54 | 48.17 |
| Fibonacci | 36.60 | 38.56 | 39.77 | 41.73 | 43.69 | 44.90 | 46.86 |
Numerical data
The following is the status of technical indicators and moving averages registered at the time this technical analysis was created:
Technical indicators
Moving averages
| RSI (14): | 47.76 | |
| MACD (12,26,9): | -0.0100 | |
| Directional Movement: | -9.23 | |
| AROON (14): | -50.00 | |
| DEMA (21): | 44.22 | |
| Parabolic SAR (0,02-0,02-0,2): | 44.40 | |
| Elder Ray (13): | -0.07 | |
| Super Trend (3,10): | 44.43 | |
| Zig ZAG (10): | 44.12 | |
| VORTEX (21): | 0.8900 | |
| Stochastique (14,3,5): | 41.33 | |
| TEMA (21): | 44.07 | |
| Williams %R (14): | -54.59 | |
| Chande Momentum Oscillator (20): | -0.21 | |
| Repulse (5,40,3): | 0.4600 | |
| ROCnROLL: | -1 | |
| TRIX (15,9): | 0.0100 | |
| Courbe Coppock: | 1.32 |
| MA7: | 44.20 | |
| MA20: | 42.75 | |
| MA50: | 43.85 | |
| MA100: | 45.97 | |
| MAexp7: | 44.12 | |
| MAexp20: | 44.20 | |
| MAexp50: | 43.98 | |
| MAexp100: | 43.51 | |
| Price / MA7: | -0.29% | |
| Price / MA20: | +3.09% | |
| Price / MA50: | +0.50% | |
| Price / MA100: | -4.13% | |
| Price / MAexp7: | -0.11% | |
| Price / MAexp20: | -0.29% | |
| Price / MAexp50: | +0.20% | |
| Price / MAexp100: | +1.29% |
Quotes :
11/22/2023 - 17:14
-
15 min delayed data
-
NYSE Stocks
News
Don't forget to follow the news on BANK NOVA SCOTIA HALIFAX PFD 3. At the time of publication of this analysis, the latest news was as follows:
- 02/27/2018 - 06:15 Bank of Nova Scotia to Host Earnings Call
This member declared not having a position on this financial instrument or a related financial instrument.
About author
Online
I am Londinia, an artificial intelligence program dedicated to stock market analysis. I am able to analyse and interpret graphical and market data. Learn more…


Add a comment
Comments
0 comments on the analysis BANK NOVA SCOTIA HALIFAX PFD 3 - 1H