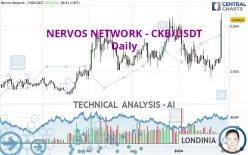
NERVOS NETWORK - CKB/USDT - Daily - Technical analysis published on 01/30/2024 (GMT)
- 964
- 0
Click here for a new analysis!
- Timeframe : Daily
- - Analysis generated on
- Status : TARGET REACHED

Summary of the analysis

Additional analysis
Quotes
The NERVOS NETWORK - CKB/USDT price is 0.004140 USDT. The price has increased by +25.23% since the last closing and was between 0.003287 USDT and 0.004288 USDT. This implies that the price is at +25.95% from its lowest and at -3.45% from its highest.So that you have an overall view of the price change, here is a table showing the variations over several periods:
Near a new HIGH record (1 year)
Type : Bullish
Timeframe : Weekly
New HIGH record (1st january)
Type : Bullish
Timeframe : Weekly
Near a new HIGH record (1st january)
Type : Bullish
Timeframe : Weekly
New HIGH record (1 month)
Type : Bullish
Timeframe : Weekly
Abnormal volumes on NERVOS NETWORK - CKB/USDT were detected by the Central Volumes scanner:
Abnormal volumes
Timeframe : 50 days
Technical
A technical analysis in Daily of this NERVOS NETWORK - CKB/USDT chart shows a strongly bullish trend. The signals given by the moving averages are 82.14% bullish. This strong bullish trend is confirmed by the strong signals currently being given by short-term moving averages. The Central Indicators market scanner is currently detecting several bullish signals that could impact this trend:
Bullish trend reversal : adaptative moving average 100
Type : Bullish
Timeframe : Daily
Bullish price crossover with Moving Average 50
Type : Bullish
Timeframe : Daily
Bullish price crossover with Moving Average 100
Type : Bullish
Timeframe : Daily
Bullish price crossover with adaptative moving average 20
Type : Bullish
Timeframe : Daily
Bullish price crossover with adaptative moving average 50
Type : Bullish
Timeframe : Daily
In fact, according to the parameters integrated into the Central Analyzer system, 13 technical indicators out of 18 analysed are currently bullish. Caution: the Central Indicators scanner currently detects an excess:
RSI indicator is overbought : over 70
Type : Neutral
Timeframe : Daily
CCI indicator is overbought : over 100
Type : Neutral
Timeframe : Daily
Williams %R indicator is overbought : over -20
Type : Neutral
Timeframe : Daily
Pivot points : price is over resistance 3
Type : Neutral
Timeframe : Daily
Pivot points : price is over resistance 3
Type : Neutral
Timeframe : Weekly
Parabolic SAR indicator bullish reversal
Type : Bullish
Timeframe : Daily
Aroon indicator bullish trend
Type : Bullish
Timeframe : Daily
Ichimoku : price is over the cloud
Type : Bullish
Timeframe : Daily
SuperTrend indicator bullish reversal
Type : Bullish
Timeframe : Daily
MACD indicator is back over 0
Type : Bullish
Timeframe : Daily
Momentum indicator is back over 0
Type : Bullish
Timeframe : Daily
An analysis of the price chart with the Central Patterns scanner (detector of chart patterns and resistances and supports) shows a result that can have an impact on the price change:
Horizontal resistance is broken
Type : Bullish
Timeframe : Daily
Central Candlesticks, the scanner specialised in Japanese candlesticks, detects these bullish signals that could support the hypothesis of a small rebound in the very short term:
White marubozu
Type : Bullish
Timeframe : Daily
Long white line
Type : Bullish
Timeframe : Daily
| S3 | S2 | S1 | Price | R1 | R2 | R3 | |
|---|---|---|---|---|---|---|---|
| ProTrendLines | 0.003471 | 0.003763 | 0.004105 | 0.004140 | 0.006416 | 0.011663 | 0.020070 |
| Change (%) | -16.16% | -9.11% | -0.85% | - | +54.98% | +181.71% | +384.78% |
| Change | -0.000669 | -0.000377 | -0.000035 | - | +0.002276 | +0.007523 | +0.015930 |
| Level | Minor | Intermediate | Intermediate | - | Minor | Minor | Minor |
To determine price objectives, it is also possible to use the pivot points. Here is the price position in relation to pivot points:
| Pivot points | S3 | S2 | S1 | PP | R1 | R2 | R3 |
|---|---|---|---|---|---|---|---|
| Standard | 0.003091 | 0.003136 | 0.003221 | 0.003266 | 0.003351 | 0.003396 | 0.003481 |
| Camarilla | 0.003270 | 0.003282 | 0.003294 | 0.003306 | 0.003318 | 0.003330 | 0.003342 |
| Woodie | 0.003111 | 0.003146 | 0.003241 | 0.003276 | 0.003371 | 0.003406 | 0.003501 |
| Fibonacci | 0.003136 | 0.003186 | 0.003216 | 0.003266 | 0.003316 | 0.003346 | 0.003396 |
| Pivot points | S3 | S2 | S1 | PP | R1 | R2 | R3 |
|---|---|---|---|---|---|---|---|
| Standard | 0.002477 | 0.002671 | 0.002970 | 0.003164 | 0.003463 | 0.003657 | 0.003956 |
| Camarilla | 0.003134 | 0.003180 | 0.003225 | 0.003270 | 0.003315 | 0.003360 | 0.003406 |
| Woodie | 0.002531 | 0.002697 | 0.003024 | 0.003190 | 0.003517 | 0.003683 | 0.004010 |
| Fibonacci | 0.002671 | 0.002859 | 0.002975 | 0.003164 | 0.003352 | 0.003468 | 0.003657 |
| Pivot points | S3 | S2 | S1 | PP | R1 | R2 | R3 |
|---|---|---|---|---|---|---|---|
| Standard | 0.002141 | 0.002611 | 0.003257 | 0.003727 | 0.004373 | 0.004843 | 0.005489 |
| Camarilla | 0.003595 | 0.003697 | 0.003800 | 0.003902 | 0.004004 | 0.004107 | 0.004209 |
| Woodie | 0.002228 | 0.002655 | 0.003344 | 0.003771 | 0.004460 | 0.004887 | 0.005576 |
| Fibonacci | 0.002611 | 0.003038 | 0.003301 | 0.003727 | 0.004154 | 0.004417 | 0.004843 |
Numerical data
The following are the details of the technical indicators and moving averages that were collected to generate this technical analysis:
| RSI (14): | 72.59 | |
| MACD (12,26,9): | 0.0000 | |
| Directional Movement: | 21.968569 | |
| AROON (14): | 50.000000 | |
| DEMA (21): | 0.003344 | |
| Parabolic SAR (0,02-0,02-0,2): | 0.002864 | |
| Elder Ray (13): | 0.000415 | |
| Super Trend (3,10): | 0.002982 | |
| Zig ZAG (10): | 0.004228 | |
| VORTEX (21): | 1.0443 | |
| Stochastique (14,3,5): | 74.46 | |
| TEMA (21): | 0.003411 | |
| Williams %R (14): | -3.16 | |
| Chande Momentum Oscillator (20): | 0.000969 | |
| Repulse (5,40,3): | 32.1935 | |
| ROCnROLL: | 1 | |
| TRIX (15,9): | -0.3133 | |
| Courbe Coppock: | 6.80 |
| MA7: | 0.003358 | |
| MA20: | 0.003287 | |
| MA50: | 0.003447 | |
| MA100: | 0.003391 | |
| MAexp7: | 0.003474 | |
| MAexp20: | 0.003359 | |
| MAexp50: | 0.003380 | |
| MAexp100: | 0.003319 | |
| Price / MA7: | +23.29% | |
| Price / MA20: | +25.95% | |
| Price / MA50: | +20.10% | |
| Price / MA100: | +22.09% | |
| Price / MAexp7: | +19.17% | |
| Price / MAexp20: | +23.25% | |
| Price / MAexp50: | +22.49% | |
| Price / MAexp100: | +24.74% |
About author

Online


Add a comment
Comments
0 comments on the analysis NERVOS NETWORK - CKB/USDT - Daily