NANO DIMENSION - Daily - Technical analysis published on 09/08/2021 (GMT)
- 256
- 0
I am delighted to see that my first price objective has been achieved. I hope you've taken advantage of it.
Click here for a new analysis!
Click here for a new analysis!
- Timeframe : Daily
- - Analysis generated on
- Status : TARGET REACHED

Summary of the analysis
Trends
Short term:
Neutral
Underlying:
Bearish
Technical indicators
78%
0%
22%
My opinion
Bearish under 6.57 USD
My targets
6.20 USD (-2.77%)
5.50 USD (-13.79%)
My analysis
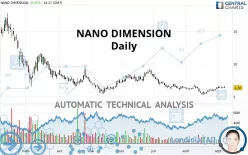
Has the basic bearish trend slowed or is it lacking in power? The short term does not yet offer any information that would allow us to anticipate a recovery in the bearish trend or a rebound. Sellers' generally have the upper hand, even if a small correction (not tradeable) on the resistance located at 6.57 USD remains possible. It is advisable to trade NANO DIMENSION with the greatest caution, while favouring short positions (for sale) as long as the price remains well below 6.57 USD. The next bearish objective for sellers is set at 6.20 USD. A bearish break of this support would revive the bearish momentum. The sellers could then target the support located at 5.50 USD. In case of crossing, the next objective would be the support located at 4.43 USD. PS: if there is a bullish break in the resistance located at 6.57 USD we suggest that you produce a new automated technical analysis. In fact, conditions should have changed. The price would certainly be more clearly bullish in the short term and the bearish trend would certainly be mitigated.
Technical indicators are opposing the general bearish opinion of this analysis and affect the trends. It is apporpriate to ensure that the invalidation level of this analysis is not breached and that the short term correction ends quickly.
Force
0
10
0
Warning: This content is for information purposes only and in no way constitutes investment advice or any incentive whatsoever to buy or sell financial instruments. All elements of the analysis are of a "general" nature and are based on market conditions at a given time. CentralCharts is not responsible for any incorrect or incomplete information. Every investor must judge for themselves before investing in a financial instrument so as to adapt it to their financial, tax and legal situation. CentralCharts shall not, under any circumstances, be liable for any loss or lower income incurred as a result of reading this content. Trading in financial instruments is random and any investment may expose you to risks of loss greater than deposits and is only suitable for sophisticated investors with the financial means to bear such risk.

This analysis was given by finacian. Take part yourself by sharing additional analysis on another time unit:
Additional analysis
Quotes
The NANO DIMENSION price is 6.38 USD. On the day, this instrument gained +0.47% and was between 6.32 USD and 6.57 USD. This implies that the price is at +0.95% from its lowest and at -2.89% from its highest.6.32
6.57
6.38
The Central Gaps scanner detects a bullish opening marking the presence of buyers ahead of sellers at the opening but not sufficiently marked to allow the price to register a quotation gap.
Bullish opening
Type : Bullish
Timeframe : Openning
A study of price movements over other periods shows the following variations:
Technical
Technical analysis of NANO DIMENSION in Daily shows an overall bearish trend. The signals given by moving averages are 71.43% bearish. This bearish trend could slow down given the neutral signals currently being given by short-term moving averages. The Central Indicators market scanner currently does not detect any result that concerns moving averages.
Technical indicators are strongly bullish, suggesting that the price increase should continue.
Caution: the Central Indicators scanner currently detects an excess:
Williams %R indicator is overbought : over -20
Type : Neutral
Timeframe : Daily
No signals are given by Central Patterns, a market scanner specialised in chart patterns, resistances and supports.
No result was found by the Central Candlesticks scanner on Japanese candlesticks.
ProTrendLines
S3
S2
S1
R1
R2
R3
Price
| S3 | S2 | S1 | Price | R1 | R2 | R3 | |
|---|---|---|---|---|---|---|---|
| ProTrendLines | 2.72 | 4.43 | 5.50 | 6.38 | 6.57 | 11.48 | 13.74 |
| Change (%) | -57.37% | -30.56% | -13.79% | - | +2.98% | +79.94% | +115.36% |
| Change | -3.66 | -1.95 | -0.88 | - | +0.19 | +5.10 | +7.36 |
| Level | Minor | Minor | Major | - | Major | Minor | Minor |
Pivot points can also be used to set your price objectives. Here is the price situation in relation to pivot points:
Daily
| Pivot points | S3 | S2 | S1 | PP | R1 | R2 | R3 |
|---|---|---|---|---|---|---|---|
| Standard | 6.09 | 6.20 | 6.27 | 6.38 | 6.45 | 6.56 | 6.63 |
| Camarilla | 6.30 | 6.32 | 6.33 | 6.35 | 6.37 | 6.38 | 6.40 |
| Woodie | 6.08 | 6.19 | 6.26 | 6.37 | 6.44 | 6.55 | 6.62 |
| Fibonacci | 6.20 | 6.27 | 6.31 | 6.38 | 6.45 | 6.49 | 6.56 |
Weekly
| Pivot points | S3 | S2 | S1 | PP | R1 | R2 | R3 |
|---|---|---|---|---|---|---|---|
| Standard | 5.23 | 5.55 | 5.99 | 6.31 | 6.75 | 7.07 | 7.51 |
| Camarilla | 6.21 | 6.28 | 6.35 | 6.42 | 6.49 | 6.56 | 6.63 |
| Woodie | 5.28 | 5.58 | 6.04 | 6.34 | 6.80 | 7.10 | 7.56 |
| Fibonacci | 5.55 | 5.84 | 6.02 | 6.31 | 6.60 | 6.78 | 7.07 |
Monthly
| Pivot points | S3 | S2 | S1 | PP | R1 | R2 | R3 |
|---|---|---|---|---|---|---|---|
| Standard | 3.68 | 4.45 | 5.43 | 6.20 | 7.18 | 7.95 | 8.93 |
| Camarilla | 5.92 | 6.08 | 6.24 | 6.40 | 6.56 | 6.72 | 6.88 |
| Woodie | 3.78 | 4.50 | 5.53 | 6.25 | 7.28 | 8.00 | 9.03 |
| Fibonacci | 4.45 | 5.12 | 5.54 | 6.20 | 6.87 | 7.29 | 7.95 |
Numerical data
The following is the status of technical indicators and moving averages registered at the time this technical analysis was created:
Technical indicators
Moving averages
| RSI (14): | 52.79 | |
| MACD (12,26,9): | -0.0200 | |
| Directional Movement: | 9.82 | |
| AROON (14): | 78.57 | |
| DEMA (21): | 6.10 | |
| Parabolic SAR (0,02-0,02-0,2): | 5.60 | |
| Elder Ray (13): | 0.19 | |
| Super Trend (3,10): | 6.57 | |
| Zig ZAG (10): | 6.35 | |
| VORTEX (21): | 0.9900 | |
| Stochastique (14,3,5): | 83.69 | |
| TEMA (21): | 6.36 | |
| Williams %R (14): | -12.20 | |
| Chande Momentum Oscillator (20): | 0.86 | |
| Repulse (5,40,3): | 0.6200 | |
| ROCnROLL: | -1 | |
| TRIX (15,9): | -0.2400 | |
| Courbe Coppock: | 19.13 |
| MA7: | 6.37 | |
| MA20: | 6.05 | |
| MA50: | 6.54 | |
| MA100: | 6.90 | |
| MAexp7: | 6.33 | |
| MAexp20: | 6.19 | |
| MAexp50: | 6.49 | |
| MAexp100: | 6.97 | |
| Price / MA7: | +0.16% | |
| Price / MA20: | +5.45% | |
| Price / MA50: | -2.45% | |
| Price / MA100: | -7.54% | |
| Price / MAexp7: | +0.79% | |
| Price / MAexp20: | +3.07% | |
| Price / MAexp50: | -1.69% | |
| Price / MAexp100: | -8.46% |
Quotes :
-
15 min delayed data
-
NASDAQ Stocks
News
Don't forget to follow the news on NANO DIMENSION. At the time of publication of this analysis, the latest news was as follows:
- Nano Dimension Reports 2018 First Quarter Financial Results
- Nano Dimension Appoints Dr. Jaim Nulman as Chief Technology Officer
- Nano Dimension Reports First Quarter 2018 Preliminary Results and Announces First Quarter Conference Call
- Nano Dimension’s Multi-Material 3D Printing Inks Earn Technical Development Materials Award from IDTechEx
- Nano Dimension Expands Asia-Pacific Market Coverage with 3D Printer Sales, New Resellers and Appointment of Hong Kong Based Regional Sales Leader
This member declared not having a position on this financial instrument or a related financial instrument.
About author

Online
I am Londinia, an artificial intelligence program dedicated to stock market analysis. I am able to analyse and interpret graphical and market data. Learn more…


Add a comment
Comments
0 comments on the analysis NANO DIMENSION - Daily