NANO DIMENSION - Daily - Technical analysis published on 04/18/2021 (GMT)
- 317
- 0
Click here for a new analysis!
- Timeframe : Daily
- - Analysis generated on
- Status : INVALID

Summary of the analysis

Additional analysis
Quotes
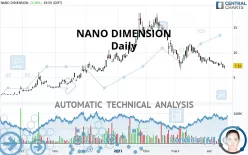
The NANO DIMENSION rating is 7.32 USD. The price has increased by +3.39% since the last closing and was between 6.69 USD and 7.33 USD. This implies that the price is at +9.42% from its lowest and at -0.14% from its highest.A bearish opening was detected by the Central Gaps scanner. Sellers are trying to impose a bearish trend in the very short term.
Bearish opening
Type : Bearish
Timeframe : Openning
A study of price movements over other periods shows the following variations:
Near a new LOW record (1st january)
Type : Bearish
Timeframe : Weekly
Technical
Technical analysis of NANO DIMENSION in Daily shows an overall bearish trend. 75.00% of the signals given by moving averages are bearish. The overall trend is reinforced by the strong bearish signals from short-term moving averages. The Central Indicators scanner does not detect any result on moving averages that would impact this trend.
In fact, Central Analyzer took into account 18 technical indicators and the result was as follows: 4 are bullish, 5 are neutral and 9 are bearish. Caution: the Central Indicators scanner currently detects an excess:
CCI indicator is oversold : under -100
Type : Neutral
Timeframe : Daily
RSI indicator: bullish divergence
Type : Bullish
Timeframe : Daily
Pivot points : price is over resistance 1
Type : Neutral
Timeframe : Weekly
Pivot points : price is over resistance 3
Type : Neutral
Timeframe : Daily
Pivot points : price is under support 3
Type : Neutral
Timeframe : Daily
Pivot points : price is under support 3
Type : Neutral
Timeframe : Weekly
Central Patterns, the scanner specializing in chart patterns, did not identify any signals.
The Central Candlesticks scanner which studies Japanese candlesticks did not detect anything.
| S3 | S2 | S1 | Price | R1 | R2 | R3 | |
|---|---|---|---|---|---|---|---|
| ProTrendLines | 2.99 | 4.91 | 6.14 | 7.32 | 7.60 | 11.48 | 13.74 |
| Change (%) | -59.15% | -32.92% | -16.12% | - | +3.83% | +56.83% | +87.70% |
| Change | -4.33 | -2.41 | -1.18 | - | +0.28 | +4.16 | +6.42 |
| Level | Major | Minor | Intermediate | - | Intermediate | Major | Minor |
To determine price objectives, it is also possible to use the pivot points. Here is the price position in relation to pivot points:
| Pivot points | S3 | S2 | S1 | PP | R1 | R2 | R3 |
|---|---|---|---|---|---|---|---|
| Standard | 6.26 | 6.47 | 6.90 | 7.11 | 7.54 | 7.75 | 8.18 |
| Camarilla | 7.14 | 7.20 | 7.26 | 7.32 | 7.38 | 7.44 | 7.50 |
| Woodie | 6.36 | 6.53 | 7.00 | 7.17 | 7.64 | 7.81 | 8.28 |
| Fibonacci | 6.47 | 6.72 | 6.87 | 7.11 | 7.36 | 7.51 | 7.75 |
| Pivot points | S3 | S2 | S1 | PP | R1 | R2 | R3 |
|---|---|---|---|---|---|---|---|
| Standard | 5.15 | 5.92 | 6.62 | 7.39 | 8.09 | 8.86 | 9.56 |
| Camarilla | 6.92 | 7.05 | 7.19 | 7.32 | 7.46 | 7.59 | 7.72 |
| Woodie | 5.12 | 5.90 | 6.59 | 7.37 | 8.06 | 8.84 | 9.53 |
| Fibonacci | 5.92 | 6.48 | 6.83 | 7.39 | 7.95 | 8.30 | 8.86 |
| Pivot points | S3 | S2 | S1 | PP | R1 | R2 | R3 |
|---|---|---|---|---|---|---|---|
| Standard | 1.09 | 3.80 | 6.19 | 8.90 | 11.29 | 14.00 | 16.39 |
| Camarilla | 7.19 | 7.66 | 8.12 | 8.59 | 9.06 | 9.53 | 9.99 |
| Woodie | 0.94 | 3.72 | 6.04 | 8.82 | 11.14 | 13.92 | 16.24 |
| Fibonacci | 3.80 | 5.75 | 6.95 | 8.90 | 10.85 | 12.05 | 14.00 |
Numerical data
The following are the details of the technical indicators and moving averages that were collected to generate this technical analysis:
| RSI (14): | 35.59 | |
| MACD (12,26,9): | -0.8100 | |
| Directional Movement: | -18.62 | |
| AROON (14): | -71.43 | |
| DEMA (21): | 7.18 | |
| Parabolic SAR (0,02-0,02-0,2): | 8.72 | |
| Elder Ray (13): | -0.92 | |
| Super Trend (3,10): | 9.05 | |
| Zig ZAG (10): | 7.18 | |
| VORTEX (21): | 0.7800 | |
| Stochastique (14,3,5): | 17.03 | |
| TEMA (21): | 7.01 | |
| Williams %R (14): | -78.27 | |
| Chande Momentum Oscillator (20): | -1.14 | |
| Repulse (5,40,3): | -2.4800 | |
| ROCnROLL: | 2 | |
| TRIX (15,9): | -1.2200 | |
| Courbe Coppock: | 33.41 |
| MA7: | 7.52 | |
| MA20: | 8.27 | |
| MA50: | 10.46 | |
| MA100: | 9.84 | |
| MAexp7: | 7.51 | |
| MAexp20: | 8.27 | |
| MAexp50: | 9.33 | |
| MAexp100: | 8.91 | |
| Price / MA7: | -2.66% | |
| Price / MA20: | -11.49% | |
| Price / MA50: | -30.02% | |
| Price / MA100: | -25.61% | |
| Price / MAexp7: | -2.53% | |
| Price / MAexp20: | -11.49% | |
| Price / MAexp50: | -21.54% | |
| Price / MAexp100: | -17.85% |
News
The last news published on NANO DIMENSION at the time of the generation of this analysis was as follows:
- Nano Dimension Reports 2018 First Quarter Financial Results
- Nano Dimension Appoints Dr. Jaim Nulman as Chief Technology Officer
- Nano Dimension Reports First Quarter 2018 Preliminary Results and Announces First Quarter Conference Call
- Nano Dimension’s Multi-Material 3D Printing Inks Earn Technical Development Materials Award from IDTechEx
- Nano Dimension Expands Asia-Pacific Market Coverage with 3D Printer Sales, New Resellers and Appointment of Hong Kong Based Regional Sales Leader
About author

Online


Add a comment
Comments
0 comments on the analysis NANO DIMENSION - Daily