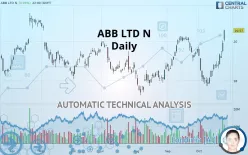
ABB LTD N - Daily - Technical analysis published on 10/25/2019 (GMT)
- 325
- 0
- Who voted?
Click here for a new analysis!
- Timeframe : Daily
- - Analysis generated on
- Status : TARGET REACHED

Summary of the analysis

Additional analysis
Quotes
ABB LTD N rating 20.57 CHF. The price has increased by +3.26% since the last closing and was between 20.00 CHF and 20.59 CHF. This implies that the price is at +2.85% from its lowest and at -0.10% from its highest.The Central Gaps scanner detects a bearish opening. A small advantage for sellers in the very short term.
Bearish opening
Type : Bearish
Timeframe : Openning
Here is a more detailed summary of the historical variations registered by ABB LTD N:
Near a new HIGH record (1 month)
Type : Bullish
Timeframe : Weekly
Technical
A technical analysis in Daily of this ABB LTD N chart shows a bullish trend. 71.43% of the signals given by moving averages are bullish. The overall trend seems to be showing some signs of weakness, as do the tentative bullish signals given by short-term moving averages. The Central Indicators scanner detects bullish signals on moving averages that could impact this trend:
Bullish trend reversal : Moving Average 100
Type : Bullish
Timeframe : Daily
Bullish trend reversal : adaptative moving average 50
Type : Bullish
Timeframe : Daily
Bullish trend reversal : adaptative moving average 100
Type : Bullish
Timeframe : Daily
Bullish price crossover with Moving Average 50
Type : Bullish
Timeframe : Daily
Bullish price crossover with Moving Average 100
Type : Bullish
Timeframe : Daily
Bullish price crossover with adaptative moving average 50
Type : Bullish
Timeframe : Daily
Bullish price crossover with adaptative moving average 100
Type : Bullish
Timeframe : Daily
In fact, 13 technical indicators on 18 studied are currently bullish. Caution: the Central Indicators scanner currently detects an excess:
Williams %R indicator is overbought : over -20
Type : Neutral
Timeframe : Daily
Pivot points : price is over resistance 1
Type : Neutral
Timeframe : Weekly
Ichimoku : price is over the cloud
Type : Bullish
Timeframe : Daily
SuperTrend indicator bullish reversal
Type : Bullish
Timeframe : Daily
Price is back over the pivot point
Type : Bullish
Timeframe : Daily
The Central Patterns scanner, which studies chart patterns, resistances and supports, has identified these signals:
Horizontal resistance is broken
Type : Bullish
Timeframe : Daily
Resistance of channel is broken
Type : Bullish
Timeframe : Daily
Resistance of triangle is broken
Type : Bullish
Timeframe : Daily
The Central Candlesticks scanner which studies Japanese candlesticks did not detect anything.
| S3 | S2 | S1 | Price | R1 | R2 | R3 | |
|---|---|---|---|---|---|---|---|
| ProTrendLines | 18.28 | 19.94 | 20.46 | 20.57 | 21.14 | 22.49 | 23.86 |
| Change (%) | -11.13% | -3.06% | -0.53% | - | +2.77% | +9.33% | +15.99% |
| Change | -2.29 | -0.63 | -0.11 | - | +0.57 | +1.92 | +3.29 |
| Level | Major | Minor | Minor | - | Major | Minor | Intermediate |
Attention could also be paid to pivot points to set price objectives:
| Pivot points | S3 | S2 | S1 | PP | R1 | R2 | R3 |
|---|---|---|---|---|---|---|---|
| Standard | 18.40 | 18.60 | 18.96 | 19.17 | 19.53 | 19.73 | 20.09 |
| Camarilla | 19.17 | 19.22 | 19.27 | 19.32 | 19.37 | 19.42 | 19.48 |
| Woodie | 18.47 | 18.64 | 19.04 | 19.20 | 19.60 | 19.77 | 20.17 |
| Fibonacci | 18.60 | 18.82 | 18.95 | 19.17 | 19.38 | 19.51 | 19.73 |
| Pivot points | S3 | S2 | S1 | PP | R1 | R2 | R3 |
|---|---|---|---|---|---|---|---|
| Standard | 17.17 | 17.45 | 17.96 | 18.24 | 18.75 | 19.03 | 19.54 |
| Camarilla | 18.26 | 18.33 | 18.40 | 18.48 | 18.55 | 18.62 | 18.69 |
| Woodie | 17.29 | 17.51 | 18.08 | 18.30 | 18.87 | 19.09 | 19.66 |
| Fibonacci | 17.45 | 17.75 | 17.94 | 18.24 | 18.54 | 18.73 | 19.03 |
| Pivot points | S3 | S2 | S1 | PP | R1 | R2 | R3 |
|---|---|---|---|---|---|---|---|
| Standard | 16.83 | 17.65 | 18.63 | 19.45 | 20.43 | 21.25 | 22.23 |
| Camarilla | 19.12 | 19.28 | 19.45 | 19.61 | 19.78 | 19.94 | 20.11 |
| Woodie | 16.91 | 17.69 | 18.71 | 19.49 | 20.51 | 21.29 | 22.31 |
| Fibonacci | 17.65 | 18.34 | 18.76 | 19.45 | 20.14 | 20.56 | 21.25 |
Numerical data
The following are the details of the technical indicators and moving averages that were collected to generate this technical analysis:
| RSI (14): | 58.25 | |
| MACD (12,26,9): | -0.0300 | |
| Directional Movement: | 9.87 | |
| AROON (14): | 64.29 | |
| DEMA (21): | 18.77 | |
| Parabolic SAR (0,02-0,02-0,2): | 18.01 | |
| Elder Ray (13): | 0.51 | |
| Super Trend (3,10): | 18.22 | |
| Zig ZAG (10): | 19.25 | |
| VORTEX (21): | 0.9600 | |
| Stochastique (14,3,5): | 78.54 | |
| TEMA (21): | 18.75 | |
| Williams %R (14): | -15.08 | |
| Chande Momentum Oscillator (20): | 1.17 | |
| Repulse (5,40,3): | 2.4400 | |
| ROCnROLL: | 1 | |
| TRIX (15,9): | -0.1100 | |
| Courbe Coppock: | 0.55 |
| MA7: | 18.89 | |
| MA20: | 18.71 | |
| MA50: | 18.90 | |
| MA100: | 18.86 | |
| MAexp7: | 18.93 | |
| MAexp20: | 18.84 | |
| MAexp50: | 18.88 | |
| MAexp100: | 18.96 | |
| Price / MA7: | +8.89% | |
| Price / MA20: | +9.94% | |
| Price / MA50: | +8.84% | |
| Price / MA100: | +9.07% | |
| Price / MAexp7: | +8.66% | |
| Price / MAexp20: | +9.18% | |
| Price / MAexp50: | +8.95% | |
| Price / MAexp100: | +8.49% |
News
The last news published on ABB LTD N at the time of the generation of this analysis was as follows:
- ABB Demonstrates Concept of Mobile Laboratory Robot for Hospital of the Future
- ABB Wins $42 Million Order for Train Technologies from Indian Railways
- Hitachi to Strengthen Energy Solutions Business with the Acquisition of ABB's Power Grids Business
- Thomas & Betts Corporation is now ABB Installation Products
- Digital Technology Pioneer ABB Expands Its Global Partnership with Salesforce
About author

Online


Add a comment
Comments
0 comments on the analysis ABB LTD N - Daily