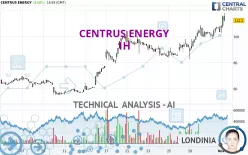
CENTRUS ENERGY - 1H - Technical analysis published on 11/01/2024 (GMT)
- 101
- 0
Click here for a new analysis!
- Timeframe : 1H
- - Analysis generated on
- Status : INVALID

Summary of the analysis

Additional analysis
Quotes
CENTRUS ENERGY rating 112.20 USD. The price registered an increase of +8.08% on the session and was between 102.77 USD and 118.00 USD. This implies that the price is at +9.18% from its lowest and at -4.92% from its highest.A bullish opening was detected by the Central Gaps scanner. Buyers are trying to impose a bullish momentum in the very short term.
Bullish opening
Type : Bullish
Timeframe : Openning
A study of price movements over other periods shows the following variations:
New HIGH record (5 years)
Type : Bullish
Timeframe : Weekly
New HIGH record (1 year)
Type : Bullish
Timeframe : Weekly
New HIGH record (1st january)
Type : Bullish
Timeframe : Weekly
New HIGH record (1 month)
Type : Bullish
Timeframe : Weekly
The Central Volumes scanner notes the presence of abnormal volumes:
Abnormal volumes
Timeframe : 5 days
Abnormal volumes
Timeframe : 20 days
Abnormal volumes
Timeframe : 50 days
Technical
Technical analysis of CENTRUS ENERGY in 1H shows a strongly overall bullish trend. 92.86% of the signals given by moving averages are bullish. The overall trend is supported by the strong bullish signals from short-term moving averages. There is no crossing of moving average by the price or crossing of moving averages between themselves.
In fact, 14 technical indicators on 18 studied are currently bullish. But beware of excesses. The Central Indicators scanner currently detects this:
RSI indicator is overbought : over 70
Type : Neutral
Timeframe : 1 hour
CCI indicator is overbought : over 100
Type : Neutral
Timeframe : 1 hour
Previous candle closed over Bollinger bands
Type : Neutral
Timeframe : 1 hour
RSI indicator: bearish divergence
Type : Bearish
Timeframe : 1 hour
Williams %R indicator is overbought : over -20
Type : Neutral
Timeframe : 1 hour
Pivot points : price is over resistance 1
Type : Neutral
Timeframe : 1 hour
Pivot points : price is over resistance 2
Type : Neutral
Timeframe : Weekly
Central Patterns, the market scanner focusing on chart patterns, resistances and supports found these results:
Near horizontal resistance
Type : Bearish
Timeframe : 1 hour
Resistance of channel is broken
Type : Bullish
Timeframe : 1 hour
The presence of these Japanese chandelier patterns detected by Central Candlesticks that could impact the current short-term trend were also noted:
Bearish harami
Type : Bearish
Timeframe : 1 hour
Doji
Type : Neutral
Timeframe : 1 hour
| S3 | S2 | S1 | Price | |
|---|---|---|---|---|
| ProTrendLines | 98.59 | 104.50 | 108.73 | 112.20 |
| Change (%) | -12.13% | -6.86% | -3.09% | - |
| Change | -13.61 | -7.70 | -3.47 | - |
| Level | Major | Minor | Intermediate | - |
Pivot points can also be used to set your price objectives. Here is the price situation in relation to pivot points:
| Pivot points | S3 | S2 | S1 | PP | R1 | R2 | R3 |
|---|---|---|---|---|---|---|---|
| Standard | 88.75 | 95.76 | 103.98 | 110.99 | 119.21 | 126.22 | 134.44 |
| Camarilla | 108.01 | 109.41 | 110.80 | 112.20 | 113.60 | 114.99 | 116.39 |
| Woodie | 89.36 | 96.06 | 104.59 | 111.29 | 119.82 | 126.52 | 135.05 |
| Fibonacci | 95.76 | 101.58 | 105.17 | 110.99 | 116.81 | 120.40 | 126.22 |
| Pivot points | S3 | S2 | S1 | PP | R1 | R2 | R3 |
|---|---|---|---|---|---|---|---|
| Standard | 58.01 | 71.01 | 78.50 | 91.50 | 98.99 | 111.99 | 119.48 |
| Camarilla | 80.36 | 82.23 | 84.11 | 85.99 | 87.87 | 89.75 | 91.63 |
| Woodie | 55.26 | 69.63 | 75.75 | 90.12 | 96.24 | 110.61 | 116.73 |
| Fibonacci | 71.01 | 78.84 | 83.67 | 91.50 | 99.33 | 104.16 | 111.99 |
| Pivot points | S3 | S2 | S1 | PP | R1 | R2 | R3 |
|---|---|---|---|---|---|---|---|
| Standard | 15.50 | 35.13 | 69.47 | 89.10 | 123.44 | 143.07 | 177.41 |
| Camarilla | 88.97 | 93.92 | 98.86 | 103.81 | 108.76 | 113.71 | 118.65 |
| Woodie | 22.86 | 38.81 | 76.83 | 92.78 | 130.80 | 146.75 | 184.77 |
| Fibonacci | 35.13 | 55.75 | 68.48 | 89.10 | 109.72 | 122.45 | 143.07 |
Numerical data
The following are the details of the technical indicators and moving averages that were collected to generate this technical analysis:
| RSI (14): | 68.83 | |
| MACD (12,26,9): | 3.6500 | |
| Directional Movement: | 18.16 | |
| AROON (14): | 50.00 | |
| DEMA (21): | 107.97 | |
| Parabolic SAR (0,02-0,02-0,2): | 98.63 | |
| Elder Ray (13): | 6.18 | |
| Super Trend (3,10): | 98.14 | |
| Zig ZAG (10): | 112.30 | |
| VORTEX (21): | 1.1900 | |
| Stochastique (14,3,5): | 73.37 | |
| TEMA (21): | 108.93 | |
| Williams %R (14): | -16.08 | |
| Chande Momentum Oscillator (20): | 9.81 | |
| Repulse (5,40,3): | 5.6700 | |
| ROCnROLL: | 1 | |
| TRIX (15,9): | 0.5100 | |
| Courbe Coppock: | 10.61 |
| MA7: | 98.52 | |
| MA20: | 82.64 | |
| MA50: | 60.25 | |
| MA100: | 51.01 | |
| MAexp7: | 107.13 | |
| MAexp20: | 103.16 | |
| MAexp50: | 97.07 | |
| MAexp100: | 88.86 | |
| Price / MA7: | +13.89% | |
| Price / MA20: | +35.77% | |
| Price / MA50: | +86.22% | |
| Price / MA100: | +119.96% | |
| Price / MAexp7: | +4.73% | |
| Price / MAexp20: | +8.76% | |
| Price / MAexp50: | +15.59% | |
| Price / MAexp100: | +26.27% |
News
Don't forget to follow the news on CENTRUS ENERGY. At the time of publication of this analysis, the latest news was as follows:
- Centrus Reports Third Quarter 2024 Results
- Centrus to Webcast Conference Call on October 29 at 8:30 a.m. ET
- Centrus Wins HALEU Enrichment Award from U.S. Department of Energy
- U.S. Department of Energy Announces Award for HALEU Deconversion
- Centrus to Participate in TD Cowen's 2024 Nuclear Fuel & Next Generation Roundtable
About author
Online


Add a comment
Comments
0 comments on the analysis CENTRUS ENERGY - 1H