| Open: | 5.85 |
| Change: | -0.17 |
| Volume: | 91,703 |
| Low: | 5.61 |
| High: | 5.86 |
| High / Low range: | 0.25 |
| Type: | ETF |
| Ticker: | EAD |
| ISIN: |
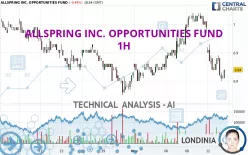
ALLSPRING INC. OPPORTUNITIES FUND - 1H - Technical analysis published on 11/13/2024 (GMT)
- 107
- 0
- 11/13/2024 - 19:10
Click here for a new analysis!
- Timeframe : 1H
- - Analysis generated on 11/13/2024 - 19:10
- Status : TARGET REACHED

Summary of the analysis

Additional analysis
Quotes
ALLSPRING INC. OPPORTUNITIES FUND rating 6.84 USD. The price is lower by -0.44% since the last closing with the lowest point at 6.80 USD and the highest point at 6.89 USD. The deviation from the price is +0.59% for the low point and -0.73% for the high point.The Central Gaps scanner detects a bullish opening marking the presence of buyers ahead of sellers at the opening but not sufficiently marked to allow the price to register a quotation gap.
Bullish opening
Type : Bullish
Timeframe : Openning
So that you have an overall view of the price change, here is a table showing the variations over several periods:
Near a new HIGH record (1 year)
Type : Bullish
Timeframe : Weekly
Near a new HIGH record (1st january)
Type : Bullish
Timeframe : Weekly
Near a new HIGH record (1 month)
Type : Bullish
Timeframe : Weekly
Technical
Technical analysis of ALLSPRING INC. OPPORTUNITIES FUND in 1H shows an overall slightly bearish trend. 57.14% of the signals given by moving averages are bearish. This bearish trend does not seem to be increasing given the slightly bearish signals given by short-term moving averages. The Central Indicators market scanner currently does not detect any result that concerns moving averages.
The probability of a further decline is high given the direction of the technical indicators.
Caution: the Central Indicators scanner currently detects an excess:
Williams %R indicator is oversold : under -80
Type : Neutral
Timeframe : 1 hour
Pivot points : price is under support 1
Type : Neutral
Timeframe : 1 hour
Pivot points : price is under support 1
Type : Neutral
Timeframe : Weekly
The Central Patterns scanner, which studies chart patterns, resistances and supports, has identified this signal:
Near support of channel
Type : Bullish
Timeframe : 1 hour
The Central Candlesticks scanner, specialised in Japanese candlesticks, did not identify any signals.
| S3 | S2 | S1 | Price | R1 | R2 | R3 | |
|---|---|---|---|---|---|---|---|
| ProTrendLines | 6.70 | 6.78 | 6.82 | 6.84 | 6.85 | 6.88 | 6.92 |
| Change (%) | -2.05% | -0.88% | -0.29% | - | +0.15% | +0.58% | +1.17% |
| Change | -0.14 | -0.06 | -0.02 | - | +0.01 | +0.04 | +0.08 |
| Level | Intermediate | Major | Minor | - | Minor | Intermediate | Minor |
Attention could also be paid to pivot points to set price objectives:
| Pivot points | S3 | S2 | S1 | PP | R1 | R2 | R3 |
|---|---|---|---|---|---|---|---|
| Standard | 6.74 | 6.79 | 6.83 | 6.88 | 6.92 | 6.97 | 7.01 |
| Camarilla | 6.85 | 6.85 | 6.86 | 6.87 | 6.88 | 6.89 | 6.90 |
| Woodie | 6.74 | 6.79 | 6.83 | 6.88 | 6.92 | 6.97 | 7.01 |
| Fibonacci | 6.79 | 6.82 | 6.85 | 6.88 | 6.91 | 6.94 | 6.97 |
| Pivot points | S3 | S2 | S1 | PP | R1 | R2 | R3 |
|---|---|---|---|---|---|---|---|
| Standard | 6.62 | 6.69 | 6.84 | 6.91 | 7.06 | 7.13 | 7.28 |
| Camarilla | 6.92 | 6.94 | 6.96 | 6.98 | 7.00 | 7.02 | 7.04 |
| Woodie | 6.65 | 6.71 | 6.87 | 6.93 | 7.09 | 7.15 | 7.31 |
| Fibonacci | 6.69 | 6.78 | 6.83 | 6.91 | 7.00 | 7.05 | 7.13 |
| Pivot points | S3 | S2 | S1 | PP | R1 | R2 | R3 |
|---|---|---|---|---|---|---|---|
| Standard | 6.19 | 6.45 | 6.61 | 6.87 | 7.03 | 7.29 | 7.45 |
| Camarilla | 6.67 | 6.70 | 6.74 | 6.78 | 6.82 | 6.86 | 6.90 |
| Woodie | 6.15 | 6.43 | 6.57 | 6.85 | 6.99 | 7.27 | 7.41 |
| Fibonacci | 6.45 | 6.61 | 6.71 | 6.87 | 7.03 | 7.13 | 7.29 |
Numerical data
The following are the details of the technical indicators and moving averages that were collected to generate this technical analysis:
| RSI (14): | 36.19 | |
| MACD (12,26,9): | -0.0200 | |
| Directional Movement: | -18.32 | |
| AROON (14): | -85.71 | |
| DEMA (21): | 6.85 | |
| Parabolic SAR (0,02-0,02-0,2): | 6.86 | |
| Elder Ray (13): | -0.05 | |
| Super Trend (3,10): | 6.89 | |
| Zig ZAG (10): | 6.82 | |
| VORTEX (21): | 0.6700 | |
| Stochastique (14,3,5): | 6.84 | |
| TEMA (21): | 6.81 | |
| Williams %R (14): | -90.62 | |
| Chande Momentum Oscillator (20): | -0.13 | |
| Repulse (5,40,3): | -0.3700 | |
| ROCnROLL: | 2 | |
| TRIX (15,9): | -0.0200 | |
| Courbe Coppock: | 3.63 |
| MA7: | 6.88 | |
| MA20: | 6.84 | |
| MA50: | 6.92 | |
| MA100: | 6.80 | |
| MAexp7: | 6.83 | |
| MAexp20: | 6.87 | |
| MAexp50: | 6.87 | |
| MAexp100: | 6.87 | |
| Price / MA7: | -0.58% | |
| Price / MA20: | -0% | |
| Price / MA50: | -1.16% | |
| Price / MA100: | +0.59% | |
| Price / MAexp7: | +0.15% | |
| Price / MAexp20: | -0.44% | |
| Price / MAexp50: | -0.44% | |
| Price / MAexp100: | -0.44% |
About author
Online


Add a comment
Comments
0 comments on the analysis ALLSPRING INC. OPPORTUNITIES FUND - 1H