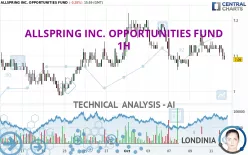
ALLSPRING INC. OPPORTUNITIES FUND - 1H - Technical analysis published on 10/14/2024 (GMT)
- 148
- 0
Click here for a new analysis!
- Timeframe : 1H
- - Analysis generated on
- Status : TARGET REACHED

Summary of the analysis

Additional analysis
Quotes
The ALLSPRING INC. OPPORTUNITIES FUND rating is 7.09 USD. The price is lower by -0.28% since the last closing and was traded between 7.09 USD and 7.13 USD over the period. The price is currently at 0% from its lowest and -0.56% from its highest.The Central Gaps scanner detects a bullish opening. A small advantage for buyers in the very short term.
Bullish opening
Type : Bullish
Timeframe : Openning
So that you have an overall view of the price change, here is a table showing the variations over several periods:
Near a new HIGH record (1 year)
Type : Bullish
Timeframe : Weekly
Near a new HIGH record (1st january)
Type : Bullish
Timeframe : Weekly
Near a new HIGH record (1 month)
Type : Bullish
Timeframe : Weekly
Technical
A technical analysis in 1H of this ALLSPRING INC. OPPORTUNITIES FUND chart shows a slightly bearish trend. Only 60.71% of the signals given by moving averages are bearish. This slightly bearish trend is not supported by the signals currently being given by short-term moving averages. The Central Indicators market scanner is currently detecting several bearish signals that could impact this trend:
Bearish trend reversal : adaptative moving average 100
Type : Bearish
Timeframe : 1 hour
Moving Average bearish crossovers : MA50 & MA100
Type : Bearish
Timeframe : 1 hour
Technical indicators are slightly bearish. There is therefore considerable uncertainty about the continuation of the decline.
But beware of excesses. The Central Indicators scanner currently detects this:
CCI indicator is oversold : under -100
Type : Neutral
Timeframe : 1 hour
Williams %R indicator is oversold : under -80
Type : Neutral
Timeframe : 1 hour
Pivot points : price is under support 1
Type : Neutral
Timeframe : 1 hour
Price is back under the pivot point
Type : Bearish
Timeframe : Weekly
Central Patterns, the market scanner focusing on chart patterns, resistances and supports found these results:
Near support of channel
Type : Bullish
Timeframe : 1 hour
Near support of triangle
Type : Bullish
Timeframe : 1 hour
The Central Candlesticks scanner currently notes the presence of this pattern in Japanese candlesticks that could mark the end of the short-term trend currently underway:
Doji
Type : Neutral
Timeframe : 1 hour
| S3 | S2 | S1 | Price | R1 | R2 | R3 | |
|---|---|---|---|---|---|---|---|
| ProTrendLines | 6.95 | 7.02 | 7.07 | 7.09 | 7.12 | 7.16 | 7.22 |
| Change (%) | -1.97% | -0.99% | -0.28% | - | +0.42% | +0.99% | +1.83% |
| Change | -0.14 | -0.07 | -0.02 | - | +0.03 | +0.07 | +0.13 |
| Level | Minor | Intermediate | Major | - | Intermediate | Minor | Minor |
Attention could also be paid to pivot points to set price objectives:
| Pivot points | S3 | S2 | S1 | PP | R1 | R2 | R3 |
|---|---|---|---|---|---|---|---|
| Standard | 7.05 | 7.08 | 7.09 | 7.12 | 7.13 | 7.16 | 7.17 |
| Camarilla | 7.10 | 7.10 | 7.11 | 7.11 | 7.11 | 7.12 | 7.12 |
| Woodie | 7.05 | 7.08 | 7.09 | 7.12 | 7.13 | 7.16 | 7.17 |
| Fibonacci | 7.08 | 7.09 | 7.10 | 7.12 | 7.13 | 7.14 | 7.16 |
| Pivot points | S3 | S2 | S1 | PP | R1 | R2 | R3 |
|---|---|---|---|---|---|---|---|
| Standard | 6.96 | 7.01 | 7.06 | 7.11 | 7.16 | 7.21 | 7.26 |
| Camarilla | 7.08 | 7.09 | 7.10 | 7.11 | 7.12 | 7.13 | 7.14 |
| Woodie | 6.96 | 7.01 | 7.06 | 7.11 | 7.16 | 7.21 | 7.26 |
| Fibonacci | 7.01 | 7.05 | 7.07 | 7.11 | 7.15 | 7.17 | 7.21 |
| Pivot points | S3 | S2 | S1 | PP | R1 | R2 | R3 |
|---|---|---|---|---|---|---|---|
| Standard | 6.74 | 6.82 | 6.98 | 7.06 | 7.22 | 7.30 | 7.46 |
| Camarilla | 7.06 | 7.09 | 7.11 | 7.13 | 7.15 | 7.17 | 7.20 |
| Woodie | 6.77 | 6.84 | 7.01 | 7.08 | 7.25 | 7.32 | 7.49 |
| Fibonacci | 6.82 | 6.92 | 6.97 | 7.06 | 7.16 | 7.21 | 7.30 |
Numerical data
The following is the status of the technical indicators and moving averages at the time of publication of this technical analysis:
| RSI (14): | 43.93 | |
| MACD (12,26,9): | 0.0000 | |
| Directional Movement: | -7.27 | |
| AROON (14): | -92.86 | |
| DEMA (21): | 7.11 | |
| Parabolic SAR (0,02-0,02-0,2): | 7.16 | |
| Elder Ray (13): | -0.01 | |
| Super Trend (3,10): | 7.08 | |
| Zig ZAG (10): | 7.10 | |
| VORTEX (21): | 0.9300 | |
| Stochastique (14,3,5): | 21.24 | |
| TEMA (21): | 7.11 | |
| Williams %R (14): | -88.89 | |
| Chande Momentum Oscillator (20): | -0.02 | |
| Repulse (5,40,3): | -0.3400 | |
| ROCnROLL: | 2 | |
| TRIX (15,9): | 0.0000 | |
| Courbe Coppock: | 0.30 |
| MA7: | 7.11 | |
| MA20: | 7.10 | |
| MA50: | 7.00 | |
| MA100: | 6.78 | |
| MAexp7: | 7.11 | |
| MAexp20: | 7.11 | |
| MAexp50: | 7.12 | |
| MAexp100: | 7.11 | |
| Price / MA7: | -0.28% | |
| Price / MA20: | -0.14% | |
| Price / MA50: | +1.29% | |
| Price / MA100: | +4.57% | |
| Price / MAexp7: | -0.28% | |
| Price / MAexp20: | -0.28% | |
| Price / MAexp50: | -0.42% | |
| Price / MAexp100: | -0.28% |
About author
Online


Add a comment
Comments
0 comments on the analysis ALLSPRING INC. OPPORTUNITIES FUND - 1H