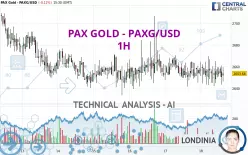
PAX GOLD - PAXG/USD - 1H - Technical analysis published on 12/18/2024 (GMT)
- 93
- 0
Click here for a new analysis!
- Timeframe : 1H
- - Analysis generated on
- Status : TARGET REACHED

Summary of the analysis

Additional analysis
Quotes
PAX GOLD - PAXG/USD rating 2,653.68 USD. The price is lower by -0.12% since the last closing and was traded between 2,642.17 USD and 2,669.67 USD over the period. The price is currently at +0.44% from its lowest and -0.60% from its highest.A bearish opening was detected by the Central Gaps scanner. Sellers are trying to impose a bearish trend in the very short term.
Bearish opening
Type : Bearish
Timeframe : Openning
So that you have an overall view of the price change, here is a table showing the variations over several periods:
Near a new HIGH record (1 month)
Type : Bullish
Timeframe : Weekly
Technical
Technical analysis of this 1H chart of PAX GOLD - PAXG/USD indicates that the overall trend is strongly bearish. 89.29% of the signals given by moving averages are bearish. The overall trend is supported by the strong bearish signals from short-term moving averages. The Central Indicators scanner detects a bearish signal on moving averages that could impact this trend:
Bearish trend reversal : Moving Average 20
Type : Bearish
Timeframe : 1 hour
On the 18 technical indicators analysed, 6 are bullish, 8 are neutral and 4 are bearish. Caution: the Central Indicators scanner currently detects an excess:
CCI indicator is oversold : under -100
Type : Neutral
Timeframe : 1 hour
CCI indicator: bullish divergence
Type : Bullish
Timeframe : 1 hour
MACD indicator: bullish divergence
Type : Bullish
Timeframe : 1 hour
RSI indicator is back over 50
Type : Bullish
Timeframe : 1 hour
The Central Patterns scanner, which studies chart patterns, resistances and supports, has identified this signal:
Near support of triangle
Type : Bullish
Timeframe : 1 hour
The presence of a bullish Japanese candlestick pattern detected by Central Candlesticks that could cause a very short term rebound was also detected:
Bullish harami
Type : Bullish
Timeframe : 1 hour
| S3 | S2 | S1 | Price | R1 | R2 | R3 | |
|---|---|---|---|---|---|---|---|
| ProTrendLines | 2,629.21 | 2,641.19 | 2,649.64 | 2,653.68 | 2,658.64 | 2,670.97 | 2,692.53 |
| Change (%) | -0.92% | -0.47% | -0.15% | - | +0.19% | +0.65% | +1.46% |
| Change | -24.47 | -12.49 | -4.04 | - | +4.96 | +17.29 | +38.85 |
| Level | Minor | Major | Intermediate | - | Minor | Intermediate | Minor |
Pivot points can also be used to set your price objectives. Here is the price situation in relation to pivot points:
| Pivot points | S3 | S2 | S1 | PP | R1 | R2 | R3 |
|---|---|---|---|---|---|---|---|
| Standard | 2,613.14 | 2,627.38 | 2,642.07 | 2,656.31 | 2,671.00 | 2,685.24 | 2,699.93 |
| Camarilla | 2,648.80 | 2,651.46 | 2,654.11 | 2,656.76 | 2,659.41 | 2,662.06 | 2,664.72 |
| Woodie | 2,613.37 | 2,627.49 | 2,642.30 | 2,656.42 | 2,671.23 | 2,685.35 | 2,700.16 |
| Fibonacci | 2,627.38 | 2,638.43 | 2,645.26 | 2,656.31 | 2,667.36 | 2,674.19 | 2,685.24 |
| Pivot points | S3 | S2 | S1 | PP | R1 | R2 | R3 |
|---|---|---|---|---|---|---|---|
| Standard | 2,470.92 | 2,532.86 | 2,592.80 | 2,654.74 | 2,714.68 | 2,776.62 | 2,836.56 |
| Camarilla | 2,619.21 | 2,630.39 | 2,641.56 | 2,652.73 | 2,663.90 | 2,675.08 | 2,686.25 |
| Woodie | 2,469.91 | 2,532.36 | 2,591.79 | 2,654.24 | 2,713.67 | 2,776.12 | 2,835.55 |
| Fibonacci | 2,532.86 | 2,579.42 | 2,608.19 | 2,654.74 | 2,701.30 | 2,730.07 | 2,776.62 |
| Pivot points | S3 | S2 | S1 | PP | R1 | R2 | R3 |
|---|---|---|---|---|---|---|---|
| Standard | 2,280.08 | 2,408.30 | 2,521.75 | 2,649.97 | 2,763.42 | 2,891.64 | 3,005.09 |
| Camarilla | 2,568.74 | 2,590.89 | 2,613.05 | 2,635.20 | 2,657.35 | 2,679.51 | 2,701.66 |
| Woodie | 2,272.70 | 2,404.61 | 2,514.37 | 2,646.28 | 2,756.04 | 2,887.95 | 2,997.71 |
| Fibonacci | 2,408.30 | 2,500.62 | 2,557.65 | 2,649.97 | 2,742.29 | 2,799.32 | 2,891.64 |
Numerical data
The following is the status of technical indicators and moving averages registered at the time this technical analysis was created:
| RSI (14): | 41.73 | |
| MACD (12,26,9): | -1.1700 | |
| Directional Movement: | 0.24 | |
| AROON (14): | -28.57 | |
| DEMA (21): | 2,653.41 | |
| Parabolic SAR (0,02-0,02-0,2): | 2,666.53 | |
| Elder Ray (13): | -3.69 | |
| Super Trend (3,10): | 2,677.56 | |
| Zig ZAG (10): | 2,652.44 | |
| VORTEX (21): | 0.9800 | |
| Stochastique (14,3,5): | 37.79 | |
| TEMA (21): | 2,654.63 | |
| Williams %R (14): | -41.56 | |
| Chande Momentum Oscillator (20): | 1.91 | |
| Repulse (5,40,3): | 0.1000 | |
| ROCnROLL: | 2 | |
| TRIX (15,9): | 0.0000 | |
| Courbe Coppock: | 0.14 |
| MA7: | 2,659.44 | |
| MA20: | 2,652.54 | |
| MA50: | 2,660.44 | |
| MA100: | 2,660.82 | |
| MAexp7: | 2,653.96 | |
| MAexp20: | 2,654.36 | |
| MAexp50: | 2,655.89 | |
| MAexp100: | 2,657.69 | |
| Price / MA7: | -0.22% | |
| Price / MA20: | +0.04% | |
| Price / MA50: | -0.25% | |
| Price / MA100: | -0.27% | |
| Price / MAexp7: | -0.01% | |
| Price / MAexp20: | -0.03% | |
| Price / MAexp50: | -0.08% | |
| Price / MAexp100: | -0.15% |
About author
Online


Add a comment
Comments
0 comments on the analysis PAX GOLD - PAXG/USD - 1H