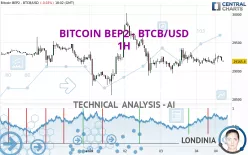
BITCOIN BEP2 - BTCB/USD - 1H - Technical analysis published on 08/04/2023 (GMT)
- 182
- 0
Click here for a new analysis!
- Timeframe : 1H
- - Analysis generated on
- Status : TARGET REACHED

Summary of the analysis
Additional analysis
Quotes
The BITCOIN BEP2 - BTCB/USD rating is 29,165.80 USD. On the day, this instrument lost -0.03% with the lowest point at 29,086.01 USD and the highest point at 29,302.71 USD. The deviation from the price is +0.27% for the low point and -0.47% for the high point.The Central Gaps scanner detects a bearish opening. A small advantage for sellers in the very short term.
Bearish opening
Type : Bearish
Timeframe : Openning
Here is a more detailed summary of the historical variations registered by BITCOIN BEP2 - BTCB/USD:
Near a new LOW record (1 month)
Type : Bearish
Timeframe : Weekly
Technical
Technical analysis of BITCOIN BEP2 - BTCB/USD in 1H shows an overall bearish trend. The signals given by moving averages are at 67.86% bearish. This bearish trend shows slight signs of slowing down given the slightly bearish signals of short-term moving averages. The Central Indicators scanner detects bullish and bearish signals on moving averages that could impact this trend:
Bullish trend reversal : Moving Average 20
Type : Bullish
Timeframe : 1 hour
Bullish trend reversal : Moving Average 50
Type : Bullish
Timeframe : 1 hour
Bearish price crossover with adaptative moving average 20
Type : Bearish
Timeframe : 1 hour
Bearish price crossover with adaptative moving average 50
Type : Bearish
Timeframe : 1 hour
In fact, Central Analyzer took into account 18 technical indicators and the result was as follows: 5 are bullish, 7 are neutral and 6 are bearish. Central Indicators, the detector scanner for these technical indicators has recently detected several signals:
RSI indicator is back under 50
Type : Bearish
Timeframe : 1 hour
Momentum indicator is back under 0
Type : Bearish
Timeframe : 1 hour
Williams %R indicator is back under -50
Type : Bearish
Timeframe : 1 hour
An analysis of the price chart with the Central Patterns scanner (detector of chart patterns and resistances and supports) shows a result that can have an impact on the price change:
Resistance of channel is broken
Type : Bullish
Timeframe : 1 hour
The Central Candlesticks scanner, specialised in Japanese candlesticks, did not identify any signals.
| S3 | S2 | S1 | Price | R1 | R2 | R3 | |
|---|---|---|---|---|---|---|---|
| ProTrendLines | 28,572.00 | 28,734.90 | 28,953.40 | 29,165.80 | 29,188.00 | 29,402.90 | 29,539.10 |
| Change (%) | -2.04% | -1.48% | -0.73% | - | +0.08% | +0.81% | +1.28% |
| Change | -593.80 | -430.90 | -212.40 | - | +22.20 | +237.10 | +373.30 |
| Level | Minor | Minor | Minor | - | Major | Intermediate | Intermediate |
Pivot points can also be used to set your price objectives. Here is the price situation in relation to pivot points:
| Pivot points | S3 | S2 | S1 | PP | R1 | R2 | R3 |
|---|---|---|---|---|---|---|---|
| Standard | 28,505.57 | 28,729.49 | 28,952.15 | 29,176.07 | 29,398.73 | 29,622.65 | 29,845.31 |
| Camarilla | 29,052.00 | 29,092.94 | 29,133.87 | 29,174.81 | 29,215.75 | 29,256.68 | 29,297.62 |
| Woodie | 28,504.94 | 28,729.18 | 28,951.52 | 29,175.76 | 29,398.10 | 29,622.34 | 29,844.68 |
| Fibonacci | 28,729.49 | 28,900.08 | 29,005.48 | 29,176.07 | 29,346.66 | 29,452.06 | 29,622.65 |
| Pivot points | S3 | S2 | S1 | PP | R1 | R2 | R3 |
|---|---|---|---|---|---|---|---|
| Standard | 27,241.23 | 28,061.67 | 28,709.13 | 29,529.57 | 30,177.03 | 30,997.47 | 31,644.93 |
| Camarilla | 28,952.93 | 29,087.49 | 29,222.04 | 29,356.60 | 29,491.16 | 29,625.72 | 29,760.27 |
| Woodie | 27,154.75 | 28,018.43 | 28,622.65 | 29,486.33 | 30,090.55 | 30,954.23 | 31,558.45 |
| Fibonacci | 28,061.67 | 28,622.40 | 28,968.83 | 29,529.57 | 30,090.30 | 30,436.73 | 30,997.47 |
| Pivot points | S3 | S2 | S1 | PP | R1 | R2 | R3 |
|---|---|---|---|---|---|---|---|
| Standard | 25,449.34 | 27,165.72 | 28,200.14 | 29,916.52 | 30,950.94 | 32,667.32 | 33,701.74 |
| Camarilla | 28,478.09 | 28,730.25 | 28,982.40 | 29,234.56 | 29,486.72 | 29,738.87 | 29,991.03 |
| Woodie | 25,108.36 | 26,995.23 | 27,859.16 | 29,746.03 | 30,609.96 | 32,496.83 | 33,360.76 |
| Fibonacci | 27,165.72 | 28,216.53 | 28,865.71 | 29,916.52 | 30,967.33 | 31,616.51 | 32,667.32 |
Numerical data
The following is the status of the technical indicators and moving averages at the time of publication of this technical analysis:
| RSI (14): | 52.62 | |
| MACD (12,26,9): | 7.6500 | |
| Directional Movement: | 8.48 | |
| AROON (14): | 7.14 | |
| DEMA (21): | 29,209.64 | |
| Parabolic SAR (0,02-0,02-0,2): | 29,371.90 | |
| Elder Ray (13): | 23.47 | |
| Super Trend (3,10): | 29,022.02 | |
| Zig ZAG (10): | 29,214.31 | |
| VORTEX (21): | 1.0000 | |
| Stochastique (14,3,5): | 65.91 | |
| TEMA (21): | 29,220.52 | |
| Williams %R (14): | -50.19 | |
| Chande Momentum Oscillator (20): | -13.74 | |
| Repulse (5,40,3): | -0.1400 | |
| ROCnROLL: | 2 | |
| TRIX (15,9): | 0.0000 | |
| Courbe Coppock: | 0.21 |
| MA7: | 29,299.29 | |
| MA20: | 29,559.61 | |
| MA50: | 29,738.40 | |
| MA100: | 28,514.28 | |
| MAexp7: | 29,214.62 | |
| MAexp20: | 29,204.12 | |
| MAexp50: | 29,209.91 | |
| MAexp100: | 29,227.33 | |
| Price / MA7: | -0.46% | |
| Price / MA20: | -1.33% | |
| Price / MA50: | -1.93% | |
| Price / MA100: | +2.28% | |
| Price / MAexp7: | -0.17% | |
| Price / MAexp20: | -0.13% | |
| Price / MAexp50: | -0.15% | |
| Price / MAexp100: | -0.21% |
About author

Online


Add a comment
Comments
0 comments on the analysis BITCOIN BEP2 - BTCB/USD - 1H