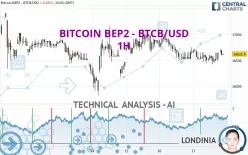
BITCOIN BEP2 - BTCB/USD - 1H - Technical analysis published on 11/17/2022 (GMT)
- 134
- 0
- Timeframe : 1H
- - Analysis generated on
- Status : NEUTRAL

Summary of the analysis
Additional analysis
Quotes
The BITCOIN BEP2 - BTCB/USD rating is 16,622.02 USD. The price registered a decrease of -0.15% on the session and was traded between 16,418.99 USD and 16,736.30 USD over the period. The price is currently at +1.24% from its lowest and -0.68% from its highest.The Central Gaps scanner detects a bullish opening marking the presence of buyers ahead of sellers at the opening but not sufficiently marked to allow the price to register a quotation gap.
Bullish opening
Type : Bullish
Timeframe : Openning
Here is a more detailed summary of the historical variations registered by BITCOIN BEP2 - BTCB/USD:
Near a new LOW record (1 year)
Type : Bearish
Timeframe : Weekly
Near a new LOW record (1 month)
Type : Bearish
Timeframe : Weekly
Technical
Technical analysis of this 1H chart of BITCOIN BEP2 - BTCB/USD indicates that the overall trend is slightly bearish. 50.00% of the signals given by moving averages are bullish. As the signals currently given by short-term moving averages are rather neutral, the overall trend could quickly return to neutral as well. An assessment of moving averages reveals several bearish signals that could impact this trend:
Bearish price crossover with Moving Average 50
Type : Bearish
Timeframe : 1 hour
Bearish price crossover with adaptative moving average 100
Type : Bearish
Timeframe : 1 hour
An assessment of technical indicators shows a strong bullish signal.
But beware of excesses. The Central Indicators scanner currently detects this:
CCI indicator is overbought : over 100
Type : Neutral
Timeframe : 1 hour
Ichimoku : price is under the cloud
Type : Bearish
Timeframe : 1 hour
An analysis of the price chart with the Central Patterns scanner (detector of chart patterns and resistances and supports) shows a result that can have an impact on the price change:
Near horizontal support
Type : Bullish
Timeframe : 1 hour
The Central Candlesticks scanner which studies Japanese candlesticks did not detect anything.
| S1 | Price | R1 | R2 | R3 | |
|---|---|---|---|---|---|
| ProTrendLines | 15,876.30 | 16,622.02 | 16,654.70 | 17,976.20 | 19,051.30 |
| Change (%) | -4.49% | - | +0.20% | +8.15% | +14.61% |
| Change | -745.72 | - | +32.68 | +1,354.18 | +2,429.28 |
| Level | Major | - | Intermediate | Intermediate | Major |
To determine price objectives, it is also possible to use the pivot points. Here is the price position in relation to pivot points:
| Pivot points | S3 | S2 | S1 | PP | R1 | R2 | R3 |
|---|---|---|---|---|---|---|---|
| Standard | 15,787.28 | 16,098.55 | 16,372.94 | 16,684.21 | 16,958.60 | 17,269.87 | 17,544.26 |
| Camarilla | 16,486.28 | 16,539.97 | 16,593.66 | 16,647.34 | 16,701.03 | 16,754.71 | 16,808.40 |
| Woodie | 15,768.85 | 16,089.33 | 16,354.51 | 16,674.99 | 16,940.17 | 17,260.65 | 17,525.83 |
| Fibonacci | 16,098.55 | 16,322.27 | 16,460.49 | 16,684.21 | 16,907.93 | 17,046.15 | 17,269.87 |
| Pivot points | S3 | S2 | S1 | PP | R1 | R2 | R3 |
|---|---|---|---|---|---|---|---|
| Standard | 8,747.34 | 12,187.67 | 14,486.04 | 17,926.37 | 20,224.74 | 23,665.07 | 25,963.44 |
| Camarilla | 15,206.27 | 15,732.32 | 16,258.36 | 16,784.41 | 17,310.46 | 17,836.51 | 18,362.55 |
| Woodie | 8,176.36 | 11,902.18 | 13,915.06 | 17,640.88 | 19,653.76 | 23,379.58 | 25,392.46 |
| Fibonacci | 12,187.67 | 14,379.85 | 15,734.19 | 17,926.37 | 20,118.55 | 21,472.89 | 23,665.07 |
| Pivot points | S3 | S2 | S1 | PP | R1 | R2 | R3 |
|---|---|---|---|---|---|---|---|
| Standard | 16,005.60 | 17,136.90 | 18,813.00 | 19,944.30 | 21,620.40 | 22,751.70 | 24,427.80 |
| Camarilla | 19,717.07 | 19,974.41 | 20,231.76 | 20,489.10 | 20,746.45 | 21,003.79 | 21,261.14 |
| Woodie | 16,278.00 | 17,273.10 | 19,085.40 | 20,080.50 | 21,892.80 | 22,887.90 | 24,700.20 |
| Fibonacci | 17,136.90 | 18,209.33 | 18,871.87 | 19,944.30 | 21,016.73 | 21,679.27 | 22,751.70 |
Numerical data
The following is the status of the technical indicators and moving averages at the time of publication of this technical analysis:
| RSI (14): | 56.38 | |
| MACD (12,26,9): | 0.0300 | |
| Directional Movement: | 4.48 | |
| AROON (14): | 35.72 | |
| DEMA (21): | 16,582.69 | |
| Parabolic SAR (0,02-0,02-0,2): | 16,415.99 | |
| Elder Ray (13): | 64.15 | |
| Super Trend (3,10): | 16,453.69 | |
| Zig ZAG (10): | 16,664.99 | |
| VORTEX (21): | 1.0500 | |
| Stochastique (14,3,5): | 88.48 | |
| TEMA (21): | 16,612.33 | |
| Williams %R (14): | -19.51 | |
| Chande Momentum Oscillator (20): | 58.47 | |
| Repulse (5,40,3): | 0.4500 | |
| ROCnROLL: | 1 | |
| TRIX (15,9): | -0.0200 | |
| Courbe Coppock: | 0.37 |
| MA7: | 16,681.05 | |
| MA20: | 18,778.64 | |
| MA50: | 19,234.14 | |
| MA100: | 20,016.05 | |
| MAexp7: | 16,619.88 | |
| MAexp20: | 16,598.28 | |
| MAexp50: | 16,633.21 | |
| MAexp100: | 16,778.79 | |
| Price / MA7: | -0.35% | |
| Price / MA20: | -11.48% | |
| Price / MA50: | -13.58% | |
| Price / MA100: | -16.96% | |
| Price / MAexp7: | +0.01% | |
| Price / MAexp20: | +0.14% | |
| Price / MAexp50: | -0.07% | |
| Price / MAexp100: | -0.94% |
About author

Online


Add a comment
Comments
0 comments on the analysis BITCOIN BEP2 - BTCB/USD - 1H