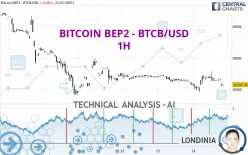
BITCOIN BEP2 - BTCB/USD - 1H - Technical analysis published on 11/14/2022 (GMT)
- 154
- 0
Click here for a new analysis!
- Timeframe : 1H
- - Analysis generated on
- Status : INVALID

Summary of the analysis
Additional analysis
Quotes
BITCOIN BEP2 - BTCB/USD rating 16,297.77 USD. On the day, this instrument lost -0.04% with the lowest point at 15,828.76 USD and the highest point at 17,164.62 USD. The deviation from the price is +2.96% for the low point and -5.05% for the high point.The Central Gaps scanner detects a bullish opening. A small advantage for buyers in the very short term.
Bullish opening
Type : Bullish
Timeframe : Openning
Here is a more detailed summary of the historical variations registered by BITCOIN BEP2 - BTCB/USD:
Near a new LOW record (1 year)
Type : Bearish
Timeframe : Weekly
Near a new LOW record (1 month)
Type : Bearish
Timeframe : Weekly
Technical
Technical analysis of this 1H chart of BITCOIN BEP2 - BTCB/USD indicates that the overall trend is strongly bearish. 89.29% of the signals given by moving averages are bearish. This strongly bearish trend is showing signs of slowing down given the slightly bearish signals given by short-term moving averages. The Central Indicators market scanner is currently detecting several bearish signals that could impact this trend:
Bearish price crossover with Moving Average 20
Type : Bearish
Timeframe : 1 hour
Bearish price crossover with adaptative moving average 20
Type : Bearish
Timeframe : 1 hour
Bearish price crossover with adaptative moving average 50
Type : Bearish
Timeframe : 1 hour
The technical indicators are generally neutral. They do not provide relevant information on the direction of future price movements.
But beware of excesses. The Central Indicators scanner currently detects this:
Williams %R indicator is oversold : under -80
Type : Neutral
Timeframe : 1 hour
MACD crosses DOWN its Moving Average
Type : Bearish
Timeframe : 1 hour
Parabolic SAR indicator bearish reversal
Type : Bearish
Timeframe : 1 hour
MACD indicator is back under 0
Type : Bearish
Timeframe : 1 hour
Central Patterns, the market scanner focusing on chart patterns, resistances and supports found these results:
Near resistance of channel
Type : Bearish
Timeframe : 1 hour
Near resistance of triangle
Type : Bearish
Timeframe : 1 hour
The presence of a bearish pattern in Japanese candlesticks detected by Central Candlesticks that could cause a correction in the very short term was also detected:
Downside gap
Type : Bearish
Timeframe : 1 hour
| S1 | Price | R1 | R2 | R3 | |
|---|---|---|---|---|---|
| ProTrendLines | 15,628.00 | 16,297.77 | 16,333.70 | 16,836.90 | 17,411.80 |
| Change (%) | -4.11% | - | +0.22% | +3.31% | +6.84% |
| Change | -669.77 | - | +35.93 | +539.13 | +1,114.03 |
| Level | Intermediate | - | Intermediate | Minor | Minor |
Pivot points can also be used to set your price objectives. Here is the price situation in relation to pivot points:
| Pivot points | S3 | S2 | S1 | PP | R1 | R2 | R3 |
|---|---|---|---|---|---|---|---|
| Standard | 15,389.17 | 15,820.95 | 16,062.54 | 16,494.32 | 16,735.91 | 17,167.69 | 17,409.28 |
| Camarilla | 16,118.94 | 16,180.67 | 16,242.39 | 16,304.12 | 16,365.85 | 16,427.57 | 16,489.30 |
| Woodie | 15,294.07 | 15,773.40 | 15,967.44 | 16,446.77 | 16,640.81 | 17,120.14 | 17,314.18 |
| Fibonacci | 15,820.95 | 16,078.18 | 16,237.10 | 16,494.32 | 16,751.55 | 16,910.47 | 17,167.69 |
| Pivot points | S3 | S2 | S1 | PP | R1 | R2 | R3 |
|---|---|---|---|---|---|---|---|
| Standard | 8,747.34 | 12,187.67 | 14,486.04 | 17,926.37 | 20,224.74 | 23,665.07 | 25,963.44 |
| Camarilla | 15,206.27 | 15,732.32 | 16,258.36 | 16,784.41 | 17,310.46 | 17,836.51 | 18,362.55 |
| Woodie | 8,176.36 | 11,902.18 | 13,915.06 | 17,640.88 | 19,653.76 | 23,379.58 | 25,392.46 |
| Fibonacci | 12,187.67 | 14,379.85 | 15,734.19 | 17,926.37 | 20,118.55 | 21,472.89 | 23,665.07 |
| Pivot points | S3 | S2 | S1 | PP | R1 | R2 | R3 |
|---|---|---|---|---|---|---|---|
| Standard | 16,005.60 | 17,136.90 | 18,813.00 | 19,944.30 | 21,620.40 | 22,751.70 | 24,427.80 |
| Camarilla | 19,717.07 | 19,974.41 | 20,231.76 | 20,489.10 | 20,746.45 | 21,003.79 | 21,261.14 |
| Woodie | 16,278.00 | 17,273.10 | 19,085.40 | 20,080.50 | 21,892.80 | 22,887.90 | 24,700.20 |
| Fibonacci | 17,136.90 | 18,209.33 | 18,871.87 | 19,944.30 | 21,016.73 | 21,679.27 | 22,751.70 |
Numerical data
The following is the status of the technical indicators and moving averages at the time of publication of this technical analysis:
| RSI (14): | 49.91 | |
| MACD (12,26,9): | 15.2600 | |
| Directional Movement: | -1.54 | |
| AROON (14): | 50.00 | |
| DEMA (21): | 16,536.69 | |
| Parabolic SAR (0,02-0,02-0,2): | 17,164.62 | |
| Elder Ray (13): | -259.15 | |
| Super Trend (3,10): | 16,127.79 | |
| Zig ZAG (10): | 16,192.36 | |
| VORTEX (21): | 0.9500 | |
| Stochastique (14,3,5): | 32.57 | |
| TEMA (21): | 16,542.58 | |
| Williams %R (14): | -99.84 | |
| Chande Momentum Oscillator (20): | -532.88 | |
| Repulse (5,40,3): | -1.4400 | |
| ROCnROLL: | 2 | |
| TRIX (15,9): | 0.0100 | |
| Courbe Coppock: | 2.26 |
| MA7: | 16,922.59 | |
| MA20: | 19,356.77 | |
| MA50: | 19,388.45 | |
| MA100: | 20,217.11 | |
| MAexp7: | 16,499.62 | |
| MAexp20: | 16,577.85 | |
| MAexp50: | 16,644.79 | |
| MAexp100: | 17,031.13 | |
| Price / MA7: | -3.69% | |
| Price / MA20: | -15.80% | |
| Price / MA50: | -15.94% | |
| Price / MA100: | -19.39% | |
| Price / MAexp7: | -1.22% | |
| Price / MAexp20: | -1.68% | |
| Price / MAexp50: | -2.08% | |
| Price / MAexp100: | -4.30% |
About author

Online


Add a comment
Comments
0 comments on the analysis BITCOIN BEP2 - BTCB/USD - 1H