| Open: | - |
| Change: | - |
| Volume: | - |
| Low: | - |
| High: | - |
| High / Low range: | - |
| Type: | Cryptocurrencies |
| Ticker: | BTCBUSD |
| ISIN: |
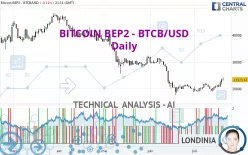
BITCOIN BEP2 - BTCB/USD - Daily - Technical analysis published on 07/20/2022 (GMT)
- 145
- 0
- 07/20/2022 - 21:11
Click here for a new analysis!
- Timeframe : Daily
- - Analysis generated on 07/20/2022 - 21:11
- Status : TARGET REACHED

Summary of the analysis
Additional analysis
Quotes
The BITCOIN BEP2 - BTCB/USD rating is 23,373.67 USD. On the day, this instrument lost -0.11% and was traded between 22,958.14 USD and 24,282.69 USD over the period. The price is currently at +1.81% from its lowest and -3.74% from its highest.The Central Gaps scanner detects a bearish opening marking the presence of sellers ahead of buyers at the opening but not sufficiently marked to allow the price to register a quotation gap.
Bearish opening
Type : Bearish
Timeframe : Openning
So that you have an overall view of the price change, here is a table showing the variations over several periods:
New HIGH record (1 month)
Type : Bullish
Timeframe : Weekly
Technical
Technical analysis of this Daily chart of BITCOIN BEP2 - BTCB/USD indicates that the overall trend is bearish. The signals given by moving averages are at 67.86% bearish. This bearish trend could slow down given the slightly bullish signals currently being given by short-term moving averages. The Central Indicators market scanner is currently detecting a bearish signal that could impact this trend:
Bearish price crossover with adaptative moving average 100
Type : Bearish
Timeframe : Daily
An assessment of technical indicators shows a strong bullish signal.
Caution: the Central Indicators scanner currently detects an excess:
CCI indicator is overbought : over 100
Type : Neutral
Timeframe : Daily
Previous candle closed over Bollinger bands
Type : Neutral
Timeframe : Daily
Williams %R indicator is overbought : over -20
Type : Neutral
Timeframe : Daily
Pivot points : price is over resistance 2
Type : Neutral
Timeframe : Weekly
An analysis of the price chart with the Central Patterns scanner (detector of chart patterns and resistances and supports) shows a result that can have an impact on the price change:
Resistance of channel is broken
Type : Bullish
Timeframe : Daily
For a small setback in the very short term, the Central Candlesticks scanner currently notes the presence of this bearish pattern in Japanese candlesticks:
Bearish harami
Type : Bearish
Timeframe : Daily
| S2 | S1 | Price | R1 | R2 | R3 | |
|---|---|---|---|---|---|---|
| ProTrendLines | 19,124.70 | 21,568.70 | 23,373.67 | 28,549.10 | 36,985.70 | 41,338.40 |
| Change (%) | -18.18% | -7.72% | - | +22.14% | +58.24% | +76.86% |
| Change | -4,248.97 | -1,804.97 | - | +5,175.43 | +13,612.03 | +17,964.73 |
| Level | Major | Intermediate | - | Minor | Minor | Minor |
Attention could also be paid to pivot points to set price objectives:
| Pivot points | S3 | S2 | S1 | PP | R1 | R2 | R3 |
|---|---|---|---|---|---|---|---|
| Standard | 20,015.13 | 20,851.13 | 22,125.36 | 22,961.36 | 24,235.59 | 25,071.59 | 26,345.82 |
| Camarilla | 22,819.27 | 23,012.71 | 23,206.14 | 23,399.58 | 23,593.02 | 23,786.46 | 23,979.89 |
| Woodie | 20,234.24 | 20,960.69 | 22,344.47 | 23,070.92 | 24,454.70 | 25,181.15 | 26,564.93 |
| Fibonacci | 20,851.13 | 21,657.24 | 22,155.26 | 22,961.36 | 23,767.47 | 24,265.49 | 25,071.59 |
| Pivot points | S3 | S2 | S1 | PP | R1 | R2 | R3 |
|---|---|---|---|---|---|---|---|
| Standard | 16,828.17 | 17,865.03 | 19,529.47 | 20,566.33 | 22,230.77 | 23,267.63 | 24,932.07 |
| Camarilla | 20,451.04 | 20,698.66 | 20,946.28 | 21,193.90 | 21,441.52 | 21,689.14 | 21,936.76 |
| Woodie | 17,141.95 | 18,021.93 | 19,843.25 | 20,723.23 | 22,544.55 | 23,424.53 | 25,245.85 |
| Fibonacci | 17,865.03 | 18,896.93 | 19,534.44 | 20,566.33 | 21,598.23 | 22,235.74 | 23,267.63 |
| Pivot points | S3 | S2 | S1 | PP | R1 | R2 | R3 |
|---|---|---|---|---|---|---|---|
| Standard | 38.80 | 8,831.30 | 14,373.60 | 23,166.10 | 28,708.40 | 37,500.90 | 43,043.20 |
| Camarilla | 15,973.83 | 17,287.85 | 18,601.88 | 19,915.90 | 21,229.92 | 22,543.95 | 23,857.97 |
| Woodie | -1,586.30 | 8,018.75 | 12,748.50 | 22,353.55 | 27,083.30 | 36,688.35 | 41,418.10 |
| Fibonacci | 8,831.30 | 14,307.19 | 17,690.21 | 23,166.10 | 28,641.99 | 32,025.01 | 37,500.90 |
Numerical data
The following are the details of the technical indicators and moving averages that were collected to generate this technical analysis:
| RSI (14): | 60.68 | |
| MACD (12,26,9): | 8.6400 | |
| Directional Movement: | 10.98 | |
| AROON (14): | 50.00 | |
| DEMA (21): | 21,103.05 | |
| Parabolic SAR (0,02-0,02-0,2): | 19,172.02 | |
| Elder Ray (13): | 2,066.52 | |
| Super Trend (3,10): | 19,827.91 | |
| Zig ZAG (10): | 23,255.25 | |
| VORTEX (21): | 1.1300 | |
| Stochastique (14,3,5): | 88.32 | |
| TEMA (21): | 22,391.12 | |
| Williams %R (14): | -18.11 | |
| Chande Momentum Oscillator (20): | 1,687.78 | |
| Repulse (5,40,3): | 5.9500 | |
| ROCnROLL: | -1 | |
| TRIX (15,9): | -0.3400 | |
| Courbe Coppock: | 14.67 |
| MA7: | 21,798.56 | |
| MA20: | 20,824.91 | |
| MA50: | 22,931.93 | |
| MA100: | 28,864.13 | |
| MAexp7: | 22,119.28 | |
| MAexp20: | 21,432.85 | |
| MAexp50: | 23,406.93 | |
| MAexp100: | 27,864.72 | |
| Price / MA7: | +7.23% | |
| Price / MA20: | +12.24% | |
| Price / MA50: | +1.93% | |
| Price / MA100: | -19.02% | |
| Price / MAexp7: | +5.67% | |
| Price / MAexp20: | +9.06% | |
| Price / MAexp50: | -0.14% | |
| Price / MAexp100: | -16.12% |
About author

Online


Add a comment
Comments
0 comments on the analysis BITCOIN BEP2 - BTCB/USD - Daily