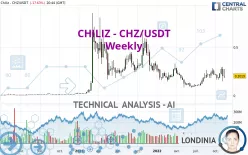
CHILIZ - CHZ/USDT - Weekly - Technical analysis published on 11/20/2022 (GMT)
- 165
- 0
Click here for a new analysis!
- Timeframe : Weekly
- - Analysis generated on
- Status : INVALID

Summary of the analysis

Additional analysis
Quotes
The CHILIZ - CHZ/USDT price is 0.201900 USDT. Over 5 days, this instrument gained +1.82% with the lowest point at 0.201900 USDT and the highest point at 0.270500 USDT. The deviation from the price is 0% for the low point and -25.36% for the high point.The Central Gaps scanner detects a bearish opening. A small advantage for sellers in the very short term.
Bullish opening
Type : Bullish
Timeframe : Openning
Bearish opening
Type : Bearish
Timeframe : Openning
So that you have an overall view of the price change, here is a table showing the variations over several periods:
Technical
A technical analysis in Weekly of this CHILIZ - CHZ/USDT chart shows a slightly bullish trend. 60.71% of the signals given by moving averages are bullish. The slightly bullish signals given by short-term moving averages do not show a strengthening of this global trend. An assessment of moving averages reveals several bearish and bullish signals:
Moving Average bullish crossovers : MA20 & MA50
Type : Bullish
Timeframe : Weekly
Bullish price crossover with Moving Average 100
Type : Bullish
Timeframe : Weekly
Bearish price crossover with adaptative moving average 20
Type : Bearish
Timeframe : Weekly
An assessment of technical indicators does not currently provide any relevant information to suggest whether the signal given by the technical indicators is more bullish or bearish.
But beware of excesses. The Central Indicators scanner currently detects this:
Williams %R indicator is overbought : over -20
Type : Neutral
Timeframe : Weekly
Price is back over the pivot point
Type : Bullish
Timeframe : Weekly
Price is back under the pivot point
Type : Bearish
Timeframe : Weekly
Momentum indicator is back under 0
Type : Bearish
Timeframe : Weekly
Williams %R indicator is back under -50
Type : Bearish
Timeframe : Weekly
The Central Patterns scanner, which studies chart patterns, resistances and supports, has identified this signal:
Near resistance of channel
Type : Bearish
Timeframe : Weekly
The presence of these Japanese chandelier patterns detected by Central Candlesticks that could impact the current short-term trend were also noted:
Bullish harami
Type : Bullish
Timeframe : Weekly
Bearish harami
Type : Bearish
Timeframe : Weekly
| S3 | S2 | S1 | Price | R1 | R2 | R3 | |
|---|---|---|---|---|---|---|---|
| ProTrendLines | 0.017256 | 0.089000 | 0.165620 | 0.201900 | 0.301000 | 0.447300 | 0.564700 |
| Change (%) | -91.45% | -55.92% | -17.97% | - | +49.08% | +121.55% | +179.69% |
| Change | -0.184644 | -0.112900 | -0.036280 | - | +0.099100 | +0.245400 | +0.362800 |
| Level | Minor | Intermediate | Major | - | Minor | Minor | Intermediate |
Attention could also be paid to pivot points to set price objectives:
| Pivot points | S3 | S2 | S1 | PP | R1 | R2 | R3 |
|---|---|---|---|---|---|---|---|
| Standard | 0.204867 | 0.224233 | 0.234667 | 0.254033 | 0.264467 | 0.283833 | 0.294267 |
| Camarilla | 0.236905 | 0.239637 | 0.242368 | 0.245100 | 0.247832 | 0.250563 | 0.253295 |
| Woodie | 0.200400 | 0.222000 | 0.230200 | 0.251800 | 0.260000 | 0.281600 | 0.289800 |
| Fibonacci | 0.224233 | 0.235617 | 0.242650 | 0.254033 | 0.265417 | 0.272450 | 0.283833 |
| Pivot points | S3 | S2 | S1 | PP | R1 | R2 | R3 |
|---|---|---|---|---|---|---|---|
| Standard | 0.097200 | 0.138100 | 0.191600 | 0.232500 | 0.286000 | 0.326900 | 0.380400 |
| Camarilla | 0.219140 | 0.227793 | 0.236447 | 0.245100 | 0.253753 | 0.262407 | 0.271060 |
| Woodie | 0.103500 | 0.141250 | 0.197900 | 0.235650 | 0.292300 | 0.330050 | 0.386700 |
| Fibonacci | 0.138100 | 0.174161 | 0.196439 | 0.232500 | 0.268561 | 0.290839 | 0.326900 |
| Pivot points | S3 | S2 | S1 | PP | R1 | R2 | R3 |
|---|---|---|---|---|---|---|---|
| Standard | 0.097867 | 0.131033 | 0.175967 | 0.209133 | 0.254067 | 0.287233 | 0.332167 |
| Camarilla | 0.199423 | 0.206582 | 0.213741 | 0.220900 | 0.228059 | 0.235218 | 0.242378 |
| Woodie | 0.103750 | 0.133975 | 0.181850 | 0.212075 | 0.259950 | 0.290175 | 0.338050 |
| Fibonacci | 0.131033 | 0.160868 | 0.179299 | 0.209133 | 0.238968 | 0.257399 | 0.287233 |
Numerical data
The following is the status of the technical indicators and moving averages at the time of publication of this technical analysis:
| RSI (14): | 51.21 | |
| MACD (12,26,9): | 0.0124 | |
| Directional Movement: | 6.288796 | |
| AROON (14): | 0 | |
| DEMA (21): | 0.216389 | |
| Parabolic SAR (0,02-0,02-0,2): | 0.296500 | |
| Elder Ray (13): | 0.013407 | |
| Super Trend (3,10): | 0.114201 | |
| Zig ZAG (10): | 0.210000 | |
| VORTEX (21): | 1.1074 | |
| Stochastique (14,3,5): | 48.68 | |
| TEMA (21): | 0.238855 | |
| Williams %R (14): | -58.03 | |
| Chande Momentum Oscillator (20): | -0.003500 | |
| Repulse (5,40,3): | -13.7828 | |
| ROCnROLL: | -1 | |
| TRIX (15,9): | 0.6849 | |
| Courbe Coppock: | 94.19 |
| MA7: | 0.229529 | |
| MA20: | 0.230760 | |
| MA50: | 0.210914 | |
| MA100: | 0.214429 | |
| MAexp7: | 0.220813 | |
| MAexp20: | 0.204225 | |
| MAexp50: | 0.205962 | |
| MAexp100: | 0.185686 | |
| Price / MA7: | -12.04% | |
| Price / MA20: | -12.51% | |
| Price / MA50: | -4.27% | |
| Price / MA100: | -5.84% | |
| Price / MAexp7: | -8.57% | |
| Price / MAexp20: | -1.14% | |
| Price / MAexp50: | -1.97% | |
| Price / MAexp100: | +8.73% |
About author

Online


Add a comment
Comments
0 comments on the analysis CHILIZ - CHZ/USDT - Weekly