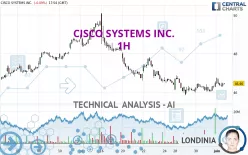
CISCO SYSTEMS INC. - 1H - Technical analysis published on 06/03/2024 (GMT)
- 136
- 0
Click here for a new analysis!
- Timeframe : 1H
- - Analysis generated on
- Status : INVALID

Summary of the analysis

Additional analysis
Quotes
CISCO SYSTEMS INC. rating 46.48 USD. The price is lower by -0.04% since the last closing with the lowest point at 46.28 USD and the highest point at 46.77 USD. The deviation from the price is +0.43% for the low point and -0.62% for the high point.The Central Gaps scanner detects a bullish gap which is a sign that buyers have taken the lead in the very short term.
Opening Gap UP
Type : Bullish
Timeframe : Openning
Here is a more detailed summary of the historical variations registered by CISCO SYSTEMS INC.:
Near a new LOW record (1 year)
Type : Bearish
Timeframe : Weekly
Near a new LOW record (1st january)
Type : Bearish
Timeframe : Weekly
Near a new LOW record (1 month)
Type : Bearish
Timeframe : Weekly
Technical
Technical analysis of this 1H chart of CISCO SYSTEMS INC. indicates that the overall trend is bearish. 67.86% of the signals given by moving averages are bearish. Caution: as the signals currently given by short-term moving averages are rather neutral, the bearish trend could slow down. An assessment of moving averages reveals several bullish signals that could impact this trend:
Bullish price crossover with adaptative moving average 20
Type : Bullish
Timeframe : 1 hour
Bullish price crossover with adaptative moving average 50
Type : Bullish
Timeframe : 1 hour
In fact, according to the parameters integrated into the Central Analyzer system, only 9 technical indicators out of 18 analysed are currently bullish. Other results related to technical indicators were also found by the Central Indicators scanner:
RSI indicator is back over 50
Type : Bullish
Timeframe : 1 hour
Price is back over the pivot point
Type : Bullish
Timeframe : 1 hour
Price is back under the pivot point
Type : Bearish
Timeframe : Weekly
Williams %R indicator is back over -50
Type : Bullish
Timeframe : 1 hour
An analysis of the price chart with the Central Patterns scanner (detector of chart patterns and resistances and supports) shows several results that can have an impact on the price change:
Near horizontal resistance
Type : Bearish
Timeframe : 1 hour
Resistance of channel is broken
Type : Bullish
Timeframe : 1 hour
The Central Candlesticks scanner, specialised in Japanese candlesticks, did not identify any signals.
| S3 | S2 | S1 | Price | R1 | R2 | R3 | |
|---|---|---|---|---|---|---|---|
| ProTrendLines | 37.49 | 44.44 | 45.85 | 46.48 | 46.87 | 47.67 | 48.34 |
| Change (%) | -19.34% | -4.39% | -1.36% | - | +0.84% | +2.56% | +4.00% |
| Change | -8.99 | -2.04 | -0.63 | - | +0.39 | +1.19 | +1.86 |
| Level | Major | Intermediate | Intermediate | - | Major | Major | Minor |
Attention could also be paid to pivot points to set price objectives:
| Pivot points | S3 | S2 | S1 | PP | R1 | R2 | R3 |
|---|---|---|---|---|---|---|---|
| Standard | 45.59 | 45.80 | 46.15 | 46.36 | 46.71 | 46.92 | 47.27 |
| Camarilla | 46.35 | 46.40 | 46.45 | 46.50 | 46.55 | 46.60 | 46.65 |
| Woodie | 45.66 | 45.84 | 46.22 | 46.40 | 46.78 | 46.96 | 47.34 |
| Fibonacci | 45.80 | 46.01 | 46.15 | 46.36 | 46.57 | 46.71 | 46.92 |
| Pivot points | S3 | S2 | S1 | PP | R1 | R2 | R3 |
|---|---|---|---|---|---|---|---|
| Standard | 44.91 | 45.38 | 45.94 | 46.41 | 46.97 | 47.44 | 48.00 |
| Camarilla | 46.22 | 46.31 | 46.41 | 46.50 | 46.59 | 46.69 | 46.78 |
| Woodie | 44.96 | 45.40 | 45.99 | 46.43 | 47.02 | 47.46 | 48.05 |
| Fibonacci | 45.38 | 45.77 | 46.02 | 46.41 | 46.80 | 47.05 | 47.44 |
| Pivot points | S3 | S2 | S1 | PP | R1 | R2 | R3 |
|---|---|---|---|---|---|---|---|
| Standard | 40.60 | 43.23 | 44.86 | 47.49 | 49.12 | 51.75 | 53.38 |
| Camarilla | 45.33 | 45.72 | 46.11 | 46.50 | 46.89 | 47.28 | 47.67 |
| Woodie | 40.11 | 42.98 | 44.37 | 47.24 | 48.63 | 51.50 | 52.89 |
| Fibonacci | 43.23 | 44.85 | 45.86 | 47.49 | 49.11 | 50.12 | 51.75 |
Numerical data
The following is the status of technical indicators and moving averages registered at the time this technical analysis was created:
| RSI (14): | 54.80 | |
| MACD (12,26,9): | -0.0100 | |
| Directional Movement: | 6.33 | |
| AROON (14): | 28.57 | |
| DEMA (21): | 46.30 | |
| Parabolic SAR (0,02-0,02-0,2): | 46.17 | |
| Elder Ray (13): | 0.04 | |
| Super Trend (3,10): | 46.69 | |
| Zig ZAG (10): | 46.44 | |
| VORTEX (21): | 1.0400 | |
| Stochastique (14,3,5): | 50.44 | |
| TEMA (21): | 46.43 | |
| Williams %R (14): | -40.79 | |
| Chande Momentum Oscillator (20): | 0.34 | |
| Repulse (5,40,3): | 0.0500 | |
| ROCnROLL: | -1 | |
| TRIX (15,9): | -0.0200 | |
| Courbe Coppock: | 0.63 |
| MA7: | 46.35 | |
| MA20: | 47.40 | |
| MA50: | 48.02 | |
| MA100: | 48.74 | |
| MAexp7: | 46.39 | |
| MAexp20: | 46.34 | |
| MAexp50: | 46.56 | |
| MAexp100: | 46.96 | |
| Price / MA7: | +0.28% | |
| Price / MA20: | -1.94% | |
| Price / MA50: | -3.21% | |
| Price / MA100: | -4.64% | |
| Price / MAexp7: | +0.17% | |
| Price / MAexp20: | +0.28% | |
| Price / MAexp50: | -0.19% | |
| Price / MAexp100: | -1.04% |
News
The latest news and videos published on CISCO SYSTEMS INC. at the time of the analysis were as follows:
- CIT Northbridge Credit Provides $75 Million to Cisco Equipment Rentals
- Legrand Products to Power Cisco Live! Network Operation Center
- Chloris Geospatial, the leading company in global forest carbon monitoring, welcomes the Cisco Foundation and NextSTEP as investors
- ZPE Systems Unveils IT Resilience Products at Cisco Live, Including Solution to Protect AI Investments
- Cisco Announces June 2024 Events with the Financial Community
About author
Online


Add a comment
Comments
0 comments on the analysis CISCO SYSTEMS INC. - 1H