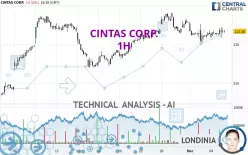
CINTAS CORP. - 1H - Technical analysis published on 12/05/2024 (GMT)
- 118
- 0
Click here for a new analysis!
- Timeframe : 1H
- - Analysis generated on
- Status : INVALID

Summary of the analysis

Additional analysis
Quotes
The CINTAS CORP. price is 223.38 USD. On the day, this instrument lost -0.10% and was traded between 221.64 USD and 224.53 USD over the period. The price is currently at +0.79% from its lowest and -0.51% from its highest.A study of price movements over other periods shows the following variations:
Near a new HIGH record (5 years)
Type : Bullish
Timeframe : Weekly
Near a new HIGH record (1 year)
Type : Bullish
Timeframe : Weekly
Near a new HIGH record (1st january)
Type : Bullish
Timeframe : Weekly
Near a new HIGH record (1 month)
Type : Bullish
Timeframe : Weekly
Technical
Technical analysis of CINTAS CORP. in 1H shows an overall bullish trend. 71.43% of the signals given by moving averages are bullish. The overall trend seems to be showing some signs of weakness, as do the tentative bullish signals given by short-term moving averages. The Central Indicators market scanner currently does not detect any result that concerns moving averages.
The probability of a further increase are moderate given the direction of the technical indicators.
The Central Indicators scanner found this result concerning these indicators:
Price is back under the pivot point
Type : Bearish
Timeframe : Weekly
Central Patterns, the market scanner focusing on chart patterns, resistances and supports found this result:
Near resistance of channel
Type : Bearish
Timeframe : 1 hour
No result was found by the Central Candlesticks scanner on Japanese candlesticks.
| S3 | S2 | S1 | Price | R1 | |
|---|---|---|---|---|---|
| ProTrendLines | 209.46 | 215.20 | 220.30 | 223.38 | 225.55 |
| Change (%) | -6.23% | -3.66% | -1.38% | - | +0.97% |
| Change | -13.92 | -8.18 | -3.08 | - | +2.17 |
| Level | Minor | Major | Intermediate | - | Major |
To determine price objectives, it is also possible to use the pivot points. Here is the price position in relation to pivot points:
| Pivot points | S3 | S2 | S1 | PP | R1 | R2 | R3 |
|---|---|---|---|---|---|---|---|
| Standard | 219.85 | 220.85 | 222.23 | 223.23 | 224.61 | 225.61 | 226.99 |
| Camarilla | 222.95 | 223.16 | 223.38 | 223.60 | 223.82 | 224.04 | 224.26 |
| Woodie | 220.03 | 220.95 | 222.41 | 223.33 | 224.79 | 225.71 | 227.17 |
| Fibonacci | 220.85 | 221.76 | 222.32 | 223.23 | 224.14 | 224.70 | 225.61 |
| Pivot points | S3 | S2 | S1 | PP | R1 | R2 | R3 |
|---|---|---|---|---|---|---|---|
| Standard | 215.53 | 218.52 | 222.15 | 225.14 | 228.77 | 231.76 | 235.39 |
| Camarilla | 223.97 | 224.58 | 225.18 | 225.79 | 226.40 | 227.00 | 227.61 |
| Woodie | 215.86 | 218.68 | 222.48 | 225.30 | 229.10 | 231.92 | 235.72 |
| Fibonacci | 218.52 | 221.05 | 222.61 | 225.14 | 227.67 | 229.23 | 231.76 |
| Pivot points | S3 | S2 | S1 | PP | R1 | R2 | R3 |
|---|---|---|---|---|---|---|---|
| Standard | 187.22 | 195.86 | 210.83 | 219.47 | 234.44 | 243.08 | 258.05 |
| Camarilla | 219.30 | 221.46 | 223.63 | 225.79 | 227.95 | 230.12 | 232.28 |
| Woodie | 190.38 | 197.44 | 213.99 | 221.05 | 237.60 | 244.66 | 261.21 |
| Fibonacci | 195.86 | 204.88 | 210.45 | 219.47 | 228.49 | 234.06 | 243.08 |
Numerical data
The following is the status of technical indicators and moving averages registered at the time this technical analysis was created:
| RSI (14): | 54.28 | |
| MACD (12,26,9): | -0.0300 | |
| Directional Movement: | 3.06 | |
| AROON (14): | 92.86 | |
| DEMA (21): | 223.02 | |
| Parabolic SAR (0,02-0,02-0,2): | 220.94 | |
| Elder Ray (13): | 0.45 | |
| Super Trend (3,10): | 225.62 | |
| Zig ZAG (10): | 223.53 | |
| VORTEX (21): | 1.0300 | |
| Stochastique (14,3,5): | 71.41 | |
| TEMA (21): | 222.92 | |
| Williams %R (14): | -32.21 | |
| Chande Momentum Oscillator (20): | 1.49 | |
| Repulse (5,40,3): | 0.4400 | |
| ROCnROLL: | 1 | |
| TRIX (15,9): | -0.0200 | |
| Courbe Coppock: | 0.80 |
| MA7: | 224.10 | |
| MA20: | 221.82 | |
| MA50: | 213.53 | |
| MA100: | 204.29 | |
| MAexp7: | 223.24 | |
| MAexp20: | 223.12 | |
| MAexp50: | 222.91 | |
| MAexp100: | 221.56 | |
| Price / MA7: | -0.32% | |
| Price / MA20: | +0.70% | |
| Price / MA50: | +4.61% | |
| Price / MA100: | +9.34% | |
| Price / MAexp7: | +0.06% | |
| Price / MAexp20: | +0.12% | |
| Price / MAexp50: | +0.21% | |
| Price / MAexp100: | +0.82% |
News
Don't forget to follow the news on CINTAS CORP.. At the time of publication of this analysis, the latest news was as follows:
- Embracing Inclusivity: Cintas’ Commitment to Accessibility
- Cincinnati CEO Applies Cintas First Aid Skills To Save a Young Girl's Life
- Cintas Once Again Hosts the NFFF 9/11 Memorial Stair Climb at TQL Stadium
- From Bronze Medalist to Employee-Partner: How Passion Richardson Applies Her Winning Skills to Cintas
- IMPACT Supports, Advances and Strengthens Cintas’ LGBTQ+ Employee-Partners
About author
Online


Add a comment
Comments
0 comments on the analysis CINTAS CORP. - 1H