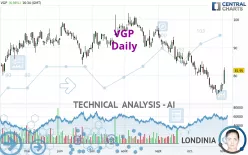
VGP - Daily - Technical analysis published on 11/03/2023 (GMT)
- 179
- 0
Click here for a new analysis!
- Timeframe : Daily
- - Analysis generated on
- Status : INVALID

Summary of the analysis

Additional analysis
Quotes
The VGP price is 81.95 EUR. On the day, this instrument gained +6.98% and was traded between 77.15 EUR and 83.05 EUR over the period. The price is currently at +6.22% from its lowest and -1.32% from its highest.A bullish gap was detected at the opening by the Central Gaps scanner. There are a lot of buyers and they have the upper hand in the very short term.
Opening Gap UP
Type : Bullish
Timeframe : Openning
Here is a more detailed summary of the historical variations registered by VGP:
Near a new HIGH record (1 month)
Type : Bullish
Timeframe : Weekly
Technical
A technical analysis in Daily of this VGP chart shows a bearish trend. 75.00% of the signals given by moving averages are bearish. Caution: as the signals currently given by short-term moving averages are rather neutral, the bearish trend could slow down. The Central Indicators scanner detects bullish signals on moving averages that could impact this trend:
Bullish price crossover with Moving Average 20
Type : Bullish
Timeframe : Daily
Bullish price crossover with adaptative moving average 20
Type : Bullish
Timeframe : Daily
Bullish price crossover with adaptative moving average 50
Type : Bullish
Timeframe : Daily
The probability of a further increase is slight given the direction of the technical indicators.
Caution: the Central Indicators scanner currently detects an excess:
Williams %R indicator is overbought : over -20
Type : Neutral
Timeframe : Daily
Pivot points : price is over resistance 3
Type : Neutral
Timeframe : Daily
Pivot points : price is over resistance 3
Type : Neutral
Timeframe : Weekly
RSI indicator is back over 50
Type : Bullish
Timeframe : Daily
Parabolic SAR indicator bullish reversal
Type : Bullish
Timeframe : Daily
SuperTrend indicator bullish reversal
Type : Bullish
Timeframe : Daily
Momentum indicator is back over 0
Type : Bullish
Timeframe : Daily
The Central Patterns scanner, which studies chart patterns, resistances and supports, has identified these signals:
Near horizontal resistance
Type : Bearish
Timeframe : Daily
Resistance of channel is broken
Type : Bullish
Timeframe : Daily
The Central Candlesticks scanner, specialised in Japanese candlesticks, did not identify any signals.
| S3 | S2 | S1 | Price | R1 | R2 | R3 | |
|---|---|---|---|---|---|---|---|
| ProTrendLines | 15.91 | 64.52 | 75.06 | 81.95 | 82.30 | 86.69 | 90.31 |
| Change (%) | -80.59% | -21.27% | -8.41% | - | +0.43% | +5.78% | +10.20% |
| Change | -66.04 | -17.43 | -6.89 | - | +0.35 | +4.74 | +8.36 |
| Level | Minor | Major | Major | - | Major | Intermediate | Minor |
Pivot points can also be used to set your price objectives. Here is the price situation in relation to pivot points:
| Pivot points | S3 | S2 | S1 | PP | R1 | R2 | R3 |
|---|---|---|---|---|---|---|---|
| Standard | 72.48 | 74.82 | 78.38 | 80.72 | 84.28 | 86.62 | 90.18 |
| Camarilla | 80.33 | 80.87 | 81.41 | 81.95 | 82.49 | 83.03 | 83.57 |
| Woodie | 73.10 | 75.13 | 79.00 | 81.03 | 84.90 | 86.93 | 90.80 |
| Fibonacci | 74.82 | 77.07 | 78.46 | 80.72 | 82.97 | 84.36 | 86.62 |
| Pivot points | S3 | S2 | S1 | PP | R1 | R2 | R3 |
|---|---|---|---|---|---|---|---|
| Standard | 69.07 | 71.08 | 72.97 | 74.98 | 76.87 | 78.88 | 80.77 |
| Camarilla | 73.78 | 74.14 | 74.49 | 74.85 | 75.21 | 75.57 | 75.92 |
| Woodie | 69.00 | 71.05 | 72.90 | 74.95 | 76.80 | 78.85 | 80.70 |
| Fibonacci | 71.08 | 72.57 | 73.49 | 74.98 | 76.47 | 77.39 | 78.88 |
| Pivot points | S3 | S2 | S1 | PP | R1 | R2 | R3 |
|---|---|---|---|---|---|---|---|
| Standard | 54.53 | 63.82 | 70.28 | 79.57 | 86.03 | 95.32 | 101.78 |
| Camarilla | 72.42 | 73.86 | 75.31 | 76.75 | 78.19 | 79.64 | 81.08 |
| Woodie | 53.13 | 63.11 | 68.88 | 78.86 | 84.63 | 94.61 | 100.38 |
| Fibonacci | 63.82 | 69.83 | 73.55 | 79.57 | 85.58 | 89.30 | 95.32 |
Numerical data
The following is the status of the technical indicators and moving averages at the time of publication of this technical analysis:
| RSI (14): | 54.68 | |
| MACD (12,26,9): | -2.3400 | |
| Directional Movement: | 8.29 | |
| AROON (14): | -64.29 | |
| DEMA (21): | 75.57 | |
| Parabolic SAR (0,02-0,02-0,2): | 73.10 | |
| Elder Ray (13): | 2.26 | |
| Super Trend (3,10): | 71.85 | |
| Zig ZAG (10): | 81.95 | |
| VORTEX (21): | 0.8700 | |
| Stochastique (14,3,5): | 50.35 | |
| TEMA (21): | 75.71 | |
| Williams %R (14): | -11.06 | |
| Chande Momentum Oscillator (20): | 1.35 | |
| Repulse (5,40,3): | 8.8600 | |
| ROCnROLL: | -1 | |
| TRIX (15,9): | -0.5200 | |
| Courbe Coppock: | 12.85 |
| MA7: | 76.26 | |
| MA20: | 78.71 | |
| MA50: | 85.12 | |
| MA100: | 89.41 | |
| MAexp7: | 77.55 | |
| MAexp20: | 78.98 | |
| MAexp50: | 83.52 | |
| MAexp100: | 86.46 | |
| Price / MA7: | +7.46% | |
| Price / MA20: | +4.12% | |
| Price / MA50: | -3.72% | |
| Price / MA100: | -8.34% | |
| Price / MAexp7: | +5.67% | |
| Price / MAexp20: | +3.76% | |
| Price / MAexp50: | -1.88% | |
| Price / MAexp100: | -5.22% |
News
Don't forget to follow the news on VGP. At the time of publication of this analysis, the latest news was as follows:
- Veterinary Growth Partners Selects Synchrony's CareCredit as Financing Solution for Members
- VGP NV: Voting Rights and Denominator
- VGP NV: Announces Closing of Seed Portfolio With New Joint Venture Partner Deka Immobilien
- VGP and Deka Immobilien Announce € 1.1 Billion Logistics Portfolio Joint Venture
- VGP Joint Venture Announces a € 253 Million Logistics Portfolio Purchase
About author
Online


Add a comment
Comments
0 comments on the analysis VGP - Daily