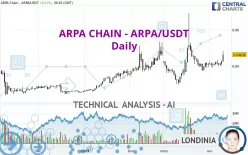
ARPA - ARPA/USDT - Daily - Technical analysis published on 04/10/2023 (GMT)
- 221
- 0
Click here for a new analysis!
- Timeframe : Daily
- - Analysis generated on
- Status : INVALID

Summary of the analysis

Additional analysis
Quotes
The ARPA CHAIN - ARPA/USDT rating is 0.046360 USDT. The price registered an increase of +9.01% on the session with the lowest point at 0.042400 USDT and the highest point at 0.048340 USDT. The deviation from the price is +9.34% for the low point and -4.10% for the high point.The Central Gaps scanner detects a bullish opening. A small advantage for buyers in the very short term.
Bullish opening
Type : Bullish
Timeframe : Openning
So that you have an overall view of the price change, here is a table showing the variations over several periods:
Technical
A technical analysis in Daily of this ARPA CHAIN - ARPA/USDT chart shows a strongly bullish trend. The signals given by moving averages are 89.29% bullish. This strongly bullish trend seems to be running out of steam given the signals being given by short-term moving averages. There is no crossing of moving average by the price or crossing of moving averages between themselves.
In fact, 15 technical indicators on 18 studied are currently bullish. Caution: the Central Indicators scanner currently detects an excess:
CCI indicator is overbought : over 100
Type : Neutral
Timeframe : Daily
Williams %R indicator is overbought : over -20
Type : Neutral
Timeframe : Daily
Pivot points : price is over resistance 1
Type : Neutral
Timeframe : Weekly
Pivot points : price is over resistance 3
Type : Neutral
Timeframe : Daily
Parabolic SAR indicator bullish reversal
Type : Bullish
Timeframe : Daily
Central Patterns, the scanner specializing in chart patterns, did not identify any signals.
No result was found by the Central Candlesticks scanner on Japanese candlesticks.
| S3 | S2 | S1 | Price | R1 | R2 | R3 | |
|---|---|---|---|---|---|---|---|
| ProTrendLines | 0.038049 | 0.041600 | 0.045332 | 0.046360 | 0.048330 | 0.051490 | 0.092490 |
| Change (%) | -17.93% | -10.27% | -2.22% | - | +4.25% | +11.07% | +99.50% |
| Change | -0.008311 | -0.004760 | -0.001028 | - | +0.001970 | +0.005130 | +0.046130 |
| Level | Major | Intermediate | Minor | - | Minor | Major | Minor |
Pivot points can also be used to set your price objectives. Here is the price situation in relation to pivot points:
| Pivot points | S3 | S2 | S1 | PP | R1 | R2 | R3 |
|---|---|---|---|---|---|---|---|
| Standard | 0.037520 | 0.038790 | 0.040660 | 0.041930 | 0.043800 | 0.045070 | 0.046940 |
| Camarilla | 0.041667 | 0.041954 | 0.042242 | 0.042530 | 0.042818 | 0.043106 | 0.043394 |
| Woodie | 0.037820 | 0.038940 | 0.040960 | 0.042080 | 0.044100 | 0.045220 | 0.047240 |
| Fibonacci | 0.038790 | 0.039990 | 0.040731 | 0.041930 | 0.043130 | 0.043871 | 0.045070 |
| Pivot points | S3 | S2 | S1 | PP | R1 | R2 | R3 |
|---|---|---|---|---|---|---|---|
| Standard | 0.035353 | 0.037317 | 0.039383 | 0.041347 | 0.043413 | 0.045377 | 0.047443 |
| Camarilla | 0.040342 | 0.040711 | 0.041081 | 0.041450 | 0.041819 | 0.042189 | 0.042558 |
| Woodie | 0.035405 | 0.037343 | 0.039435 | 0.041373 | 0.043465 | 0.045403 | 0.047495 |
| Fibonacci | 0.037317 | 0.038856 | 0.039807 | 0.041347 | 0.042886 | 0.043837 | 0.045377 |
| Pivot points | S3 | S2 | S1 | PP | R1 | R2 | R3 |
|---|---|---|---|---|---|---|---|
| Standard | -0.015410 | 0.007090 | 0.024190 | 0.046690 | 0.063790 | 0.086290 | 0.103390 |
| Camarilla | 0.030400 | 0.034030 | 0.037660 | 0.041290 | 0.044920 | 0.048550 | 0.052180 |
| Woodie | -0.018110 | 0.005740 | 0.021490 | 0.045340 | 0.061090 | 0.084940 | 0.100690 |
| Fibonacci | 0.007090 | 0.022217 | 0.031563 | 0.046690 | 0.061817 | 0.071163 | 0.086290 |
Numerical data
The following is the status of technical indicators and moving averages registered at the time this technical analysis was created:
| RSI (14): | 62.12 | |
| MACD (12,26,9): | 0.0006 | |
| Directional Movement: | 17.700311 | |
| AROON (14): | 100.000000 | |
| DEMA (21): | 0.042645 | |
| Parabolic SAR (0,02-0,02-0,2): | 0.037270 | |
| Elder Ray (13): | 0.002540 | |
| Super Trend (3,10): | 0.049156 | |
| Zig ZAG (10): | 0.047430 | |
| VORTEX (21): | 0.9488 | |
| Stochastique (14,3,5): | 85.43 | |
| TEMA (21): | 0.042987 | |
| Williams %R (14): | -0.39 | |
| Chande Momentum Oscillator (20): | 0.006230 | |
| Repulse (5,40,3): | 18.5485 | |
| ROCnROLL: | 1 | |
| TRIX (15,9): | 0.0990 | |
| Courbe Coppock: | 7.31 |
| MA7: | 0.042499 | |
| MA20: | 0.041391 | |
| MA50: | 0.041147 | |
| MA100: | 0.037151 | |
| MAexp7: | 0.043207 | |
| MAexp20: | 0.041739 | |
| MAexp50: | 0.040501 | |
| MAexp100: | 0.038294 | |
| Price / MA7: | +9.08% | |
| Price / MA20: | +12.01% | |
| Price / MA50: | +12.67% | |
| Price / MA100: | +24.79% | |
| Price / MAexp7: | +7.30% | |
| Price / MAexp20: | +11.07% | |
| Price / MAexp50: | +14.47% | |
| Price / MAexp100: | +21.06% |
About author

Online


Add a comment
Comments
0 comments on the analysis ARPA - ARPA/USDT - Daily