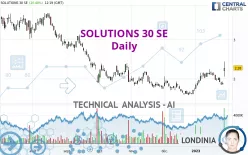
SOLUTIONS 30 SE - Daily - Technical analysis published on 01/27/2023 (GMT)
- 212
- 0
Click here for a new analysis!
- Timeframe : Daily
- - Analysis generated on
- Status : TARGET REACHED

Summary of the analysis

Additional analysis
Quotes
The SOLUTIONS 30 SE price is 2.2800 EUR. The price has increased by +20.48% since the last closing with the lowest point at 2.0600 EUR and the highest point at 2.4450 EUR. The deviation from the price is +10.68% for the low point and -6.75% for the high point.The Central Gaps scanner detects the formation of a bullish gap marking the strong presence of buyers against sellers at the opening. This formed a quotation gap.
Opening Gap UP
Type : Bullish
Timeframe : Openning
Here is a more detailed summary of the historical variations registered by SOLUTIONS 30 SE:
New HIGH record (1st january)
Type : Bullish
Timeframe : Weekly
New HIGH record (1 month)
Type : Bullish
Timeframe : Weekly
Technical
Technical analysis of SOLUTIONS 30 SE in Daily shows an overall bullish trend. 64.29% of the signals given by moving averages are bullish. This bullish trend is supported by the strong bullish signals given by short-term moving averages. The Central Indicators scanner detects bullish signals on moving averages that could impact this trend:
Bullish price crossover with Moving Average 20
Type : Bullish
Timeframe : Daily
Bullish price crossover with Moving Average 100
Type : Bullish
Timeframe : Daily
Bullish price crossover with adaptative moving average 20
Type : Bullish
Timeframe : Daily
Bullish price crossover with adaptative moving average 50
Type : Bullish
Timeframe : Daily
Bullish price crossover with adaptative moving average 100
Type : Bullish
Timeframe : Daily
In fact, 12 technical indicators on 18 studied are currently positioned bullish. Caution: the Central Indicators scanner currently detects an excess:
CCI indicator is overbought : over 100
Type : Neutral
Timeframe : Daily
Pivot points : price is over resistance 2
Type : Neutral
Timeframe : Weekly
Pivot points : price is over resistance 3
Type : Neutral
Timeframe : Daily
RSI indicator is back over 50
Type : Bullish
Timeframe : Daily
Parabolic SAR indicator bullish reversal
Type : Bullish
Timeframe : Daily
Aroon indicator bullish trend
Type : Bullish
Timeframe : Daily
Ichimoku : price is over the cloud
Type : Bullish
Timeframe : Daily
Momentum indicator is back over 0
Type : Bullish
Timeframe : Daily
Williams %R indicator is back over -50
Type : Bullish
Timeframe : Daily
The Central Patterns scanner, which studies chart patterns, resistances and supports, has identified this signal:
Horizontal resistance is broken
Type : Bullish
Timeframe : Daily
For a small rebound in the very short term, the Central Candlesticks scanner currently notes the presence of these bullish patterns in Japanese candlesticks:
Upside gap
Type : Bullish
Timeframe : Daily
Long white line
Type : Bullish
Timeframe : Daily
| S3 | S2 | S1 | Price | R1 | R2 | R3 | |
|---|---|---|---|---|---|---|---|
| ProTrendLines | 0.7455 | 1.6234 | 2.1577 | 2.2800 | 2.7419 | 3.6500 | 5.8875 |
| Change (%) | -67.30% | -28.80% | -5.36% | - | +20.26% | +60.09% | +158.22% |
| Change | -1.5345 | -0.6566 | -0.1223 | - | +0.4619 | +1.3700 | +3.6075 |
| Level | Major | Major | Major | - | Intermediate | Major | Intermediate |
Pivot points can also be used to set your price objectives. Here is the price situation in relation to pivot points:
| Pivot points | S3 | S2 | S1 | PP | R1 | R2 | R3 |
|---|---|---|---|---|---|---|---|
| Standard | 1.7883 | 1.8242 | 1.8583 | 1.8942 | 1.9283 | 1.9642 | 1.9983 |
| Camarilla | 1.8733 | 1.8797 | 1.8861 | 1.8925 | 1.8989 | 1.9053 | 1.9118 |
| Woodie | 1.7875 | 1.8238 | 1.8575 | 1.8938 | 1.9275 | 1.9638 | 1.9975 |
| Fibonacci | 1.8242 | 1.8509 | 1.8674 | 1.8942 | 1.9209 | 1.9374 | 1.9642 |
| Pivot points | S3 | S2 | S1 | PP | R1 | R2 | R3 |
|---|---|---|---|---|---|---|---|
| Standard | 1.6355 | 1.7910 | 1.8790 | 2.0345 | 2.1225 | 2.2780 | 2.3660 |
| Camarilla | 1.9000 | 1.9224 | 1.9447 | 1.9670 | 1.9893 | 2.0116 | 2.0340 |
| Woodie | 1.6018 | 1.7741 | 1.8453 | 2.0176 | 2.0888 | 2.2611 | 2.3323 |
| Fibonacci | 1.7910 | 1.8840 | 1.9415 | 2.0345 | 2.1275 | 2.1850 | 2.2780 |
| Pivot points | S3 | S2 | S1 | PP | R1 | R2 | R3 |
|---|---|---|---|---|---|---|---|
| Standard | 1.0220 | 1.3020 | 1.5040 | 1.7840 | 1.9860 | 2.2660 | 2.4680 |
| Camarilla | 1.5735 | 1.6176 | 1.6618 | 1.7060 | 1.7502 | 1.7944 | 1.8386 |
| Woodie | 0.9830 | 1.2825 | 1.4650 | 1.7645 | 1.9470 | 2.2465 | 2.4290 |
| Fibonacci | 1.3020 | 1.4861 | 1.5999 | 1.7840 | 1.9681 | 2.0819 | 2.2660 |
Numerical data
The following is the status of technical indicators and moving averages registered at the time this technical analysis was created:
| RSI (14): | 65.16 | |
| MACD (12,26,9): | 0.0441 | |
| Directional Movement: | 27.3956 | |
| AROON (14): | 14.2857 | |
| DEMA (21): | 2.0547 | |
| Parabolic SAR (0,02-0,02-0,2): | 1.8410 | |
| Elder Ray (13): | 0.2340 | |
| Super Trend (3,10): | 1.8362 | |
| Zig ZAG (10): | 2.2880 | |
| VORTEX (21): | 1.0704 | |
| Stochastique (14,3,5): | 30.20 | |
| TEMA (21): | 2.0824 | |
| Williams %R (14): | -26.16 | |
| Chande Momentum Oscillator (20): | 0.1460 | |
| Repulse (5,40,3): | 0.9616 | |
| ROCnROLL: | 1 | |
| TRIX (15,9): | 0.4234 | |
| Courbe Coppock: | 1.11 |
| MA7: | 1.9866 | |
| MA20: | 2.0364 | |
| MA50: | 1.8782 | |
| MA100: | 2.0590 | |
| MAexp7: | 2.0332 | |
| MAexp20: | 1.9945 | |
| MAexp50: | 1.9819 | |
| MAexp100: | 2.2886 | |
| Price / MA7: | +14.77% | |
| Price / MA20: | +11.96% | |
| Price / MA50: | +21.39% | |
| Price / MA100: | +10.73% | |
| Price / MAexp7: | +12.14% | |
| Price / MAexp20: | +14.31% | |
| Price / MAexp50: | +15.04% | |
| Price / MAexp100: | -0.38% |
News
The latest news and videos published on SOLUTIONS 30 SE at the time of the analysis were as follows:
- 2022 Revenue Report
- Shareholding notification
- 2022 Q3 Revenue Report
- Return to growth during the second quarter of 2022
- Solutions 30 broadens cooperation with Orange Poland to Warsaw zone
About author
Online


Add a comment
Comments
0 comments on the analysis SOLUTIONS 30 SE - Daily