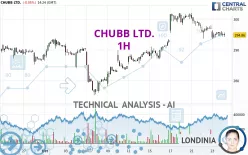
CHUBB LTD. - 1H - Technical analysis published on 10/24/2024 (GMT)
- 131
- 0
Click here for a new analysis!
- Timeframe : 1H
- - Analysis generated on
- Status : TARGET REACHED

Summary of the analysis

Additional analysis
Quotes
The CHUBB LTD. price is 294.86 USD. The price is lower by -0.05% since the last closing with the lowest point at 294.27 USD and the highest point at 295.67 USD. The deviation from the price is +0.20% for the low point and -0.27% for the high point.The Central Gaps scanner detects a bullish opening marking the presence of buyers ahead of sellers at the opening but not sufficiently marked to allow the price to register a quotation gap.
Bullish opening
Type : Bullish
Timeframe : Openning
A study of price movements over other periods shows the following variations:
Near a new HIGH record (5 years)
Type : Bullish
Timeframe : Weekly
Near a new HIGH record (1 year)
Type : Bullish
Timeframe : Weekly
Near a new HIGH record (1st january)
Type : Bullish
Timeframe : Weekly
Near a new HIGH record (1 month)
Type : Bullish
Timeframe : Weekly
Technical
A technical analysis in 1H of this CHUBB LTD. chart shows a slightly bullish trend. 57.14% of the signals given by moving averages are bullish. Caution: the strong bearish signals currently being given by short-term moving averages indicate that this slightly bullish trend could be reversed. The Central Indicators scanner does not detect any result on moving averages that would impact this trend.
Technical indicators are bearish. There is still some doubt about the decline in the price.
Central Indicators, the scanner specialised in technical indicators, has identified these signals:
Price is back under the pivot point
Type : Bearish
Timeframe : 1 hour
Price is back under the pivot point
Type : Bearish
Timeframe : Weekly
An analysis of the price chart with the Central Patterns scanner (detector of chart patterns and resistances and supports) shows a result that can have an impact on the price change:
Near horizontal support
Type : Bullish
Timeframe : 1 hour
The Central Candlesticks scanner, specialised in Japanese candlesticks, did not identify any signals.
| S3 | S2 | S1 | Price | R1 | R2 | |
|---|---|---|---|---|---|---|
| ProTrendLines | 285.68 | 289.09 | 292.12 | 294.86 | 298.07 | 302.02 |
| Change (%) | -3.11% | -1.96% | -0.93% | - | +1.09% | +2.43% |
| Change | -9.18 | -5.77 | -2.74 | - | +3.21 | +7.16 |
| Level | Minor | Minor | Major | - | Minor | Intermediate |
Pivot points can also be used to set your price objectives. Here is the price situation in relation to pivot points:
| Pivot points | S3 | S2 | S1 | PP | R1 | R2 | R3 |
|---|---|---|---|---|---|---|---|
| Standard | 290.57 | 292.05 | 293.52 | 295.00 | 296.47 | 297.95 | 299.42 |
| Camarilla | 294.19 | 294.46 | 294.73 | 295.00 | 295.27 | 295.54 | 295.81 |
| Woodie | 290.58 | 292.05 | 293.53 | 295.00 | 296.48 | 297.95 | 299.43 |
| Fibonacci | 292.05 | 293.17 | 293.87 | 295.00 | 296.12 | 296.82 | 297.95 |
| Pivot points | S3 | S2 | S1 | PP | R1 | R2 | R3 |
|---|---|---|---|---|---|---|---|
| Standard | 274.22 | 279.87 | 290.76 | 296.41 | 307.30 | 312.95 | 323.84 |
| Camarilla | 297.11 | 298.63 | 300.14 | 301.66 | 303.18 | 304.69 | 306.21 |
| Woodie | 276.85 | 281.18 | 293.39 | 297.72 | 309.93 | 314.26 | 326.47 |
| Fibonacci | 279.87 | 286.19 | 290.09 | 296.41 | 302.73 | 306.63 | 312.95 |
| Pivot points | S3 | S2 | S1 | PP | R1 | R2 | R3 |
|---|---|---|---|---|---|---|---|
| Standard | 270.83 | 276.28 | 282.34 | 287.79 | 293.85 | 299.30 | 305.36 |
| Camarilla | 285.23 | 286.28 | 287.34 | 288.39 | 289.45 | 290.50 | 291.56 |
| Woodie | 271.13 | 276.43 | 282.64 | 287.94 | 294.15 | 299.45 | 305.66 |
| Fibonacci | 276.28 | 280.68 | 283.40 | 287.79 | 292.19 | 294.91 | 299.30 |
Numerical data
The following is the status of the technical indicators and moving averages at the time of publication of this technical analysis:
| RSI (14): | 40.33 | |
| MACD (12,26,9): | -0.5600 | |
| Directional Movement: | -9.88 | |
| AROON (14): | -7.15 | |
| DEMA (21): | 295.63 | |
| Parabolic SAR (0,02-0,02-0,2): | 297.44 | |
| Elder Ray (13): | -0.75 | |
| Super Trend (3,10): | 299.44 | |
| Zig ZAG (10): | 295.05 | |
| VORTEX (21): | 0.8400 | |
| Stochastique (14,3,5): | 32.93 | |
| TEMA (21): | 294.27 | |
| Williams %R (14): | -69.55 | |
| Chande Momentum Oscillator (20): | -2.14 | |
| Repulse (5,40,3): | -0.0600 | |
| ROCnROLL: | -1 | |
| TRIX (15,9): | -0.0200 | |
| Courbe Coppock: | 1.52 |
| MA7: | 297.35 | |
| MA20: | 290.46 | |
| MA50: | 286.29 | |
| MA100: | 274.49 | |
| MAexp7: | 295.27 | |
| MAexp20: | 296.11 | |
| MAexp50: | 295.20 | |
| MAexp100: | 292.91 | |
| Price / MA7: | -0.84% | |
| Price / MA20: | +1.51% | |
| Price / MA50: | +2.99% | |
| Price / MA100: | +7.42% | |
| Price / MAexp7: | -0.14% | |
| Price / MAexp20: | -0.42% | |
| Price / MAexp50: | -0.12% | |
| Price / MAexp100: | +0.67% |
News
The last news published on CHUBB LTD. at the time of the generation of this analysis was as follows:
- Chubb's Digital Payments and Cyber Scams Survey Finds Growing Impact of Fraud on Consumers; Harms Trust in Payment Methods
- Chubb Limited to Hold its Third Quarter Earnings Conference Call on Wednesday, October 30, 2024
- CHUBB RENEWS AS OFFICIAL INSURANCE SPONSOR OF THE US OPEN WITH MULTI-YEAR AGREEMENT
- Chubb Appoints Greg Giardiello as Global Controller
- Chubb Appoints George Ohsiek Chief Accounting Officer; Annmarie Hagan Named CFO of Operations & Technology and Transformation; Mong-Diep "Dee" Le to serve as Chief Auditor
About author
Online


Add a comment
Comments
0 comments on the analysis CHUBB LTD. - 1H