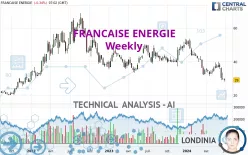
FRANCAISE ENERGIE - Weekly - Technical analysis published on 06/28/2024 (GMT)
- 128
- 0
Click here for a new analysis!
- Timeframe : Weekly
- - Analysis generated on
- Status : INVALID

Summary of the analysis

Additional analysis
Quotes
FRANCAISE ENERGIE rating 29.00 EUR. The price registered a decrease of -2.85% over 5 days and has been traded over the last 5 days between 28.10 EUR and 30.10 EUR. This implies that the 5 day price is +3.20% from its lowest point and -3.65% from its highest point.A bullish opening was detected by the Central Gaps scanner. Buyers are trying to impose a bullish momentum in the very short term.
Bullish opening
Type : Bullish
Timeframe : Openning
So that you have an overall view of the price change, here is a table showing the variations over several periods:
New LOW record (1 year)
Type : Bearish
Timeframe : Weekly
New LOW record (1st january)
Type : Bearish
Timeframe : Weekly
New LOW record (1 month)
Type : Bearish
Timeframe : Weekly
Technical
Technical analysis of FRANCAISE ENERGIE in Weekly shows a overall strongly bearish trend. The signals given by moving averages are 92.86% bearish. This strong bearish trend is confirmed by the strong signals currently being given by short-term moving averages. The Central Indicators market scanner currently does not detect any result that concerns moving averages.
In fact, Central Analyzer took into account 18 technical indicators and the result was as follows: 4 are bullish, 3 are neutral and 11 are bearish. Caution: the Central Indicators scanner currently detects an excess:
CCI indicator is oversold : under -100
Type : Neutral
Timeframe : Weekly
Williams %R indicator is oversold : under -80
Type : Neutral
Timeframe : Weekly
The Central Patterns scanner, which studies chart patterns, resistances and supports, has identified this signal:
Support of channel is broken
Type : Bearish
Timeframe : Weekly
No result was found by the Central Candlesticks scanner on Japanese candlesticks.
| S2 | S1 | Price | R1 | R2 | R3 | |
|---|---|---|---|---|---|---|
| ProTrendLines | 19.70 | 24.12 | 29.00 | 31.99 | 39.27 | 52.78 |
| Change (%) | -32.07% | -16.83% | - | +10.31% | +35.41% | +82.00% |
| Change | -9.30 | -4.88 | - | +2.99 | +10.27 | +23.78 |
| Level | Intermediate | Minor | - | Intermediate | Major | Major |
To determine price objectives, it is also possible to use the pivot points. Here is the price position in relation to pivot points:
| Pivot points | S3 | S2 | S1 | PP | R1 | R2 | R3 |
|---|---|---|---|---|---|---|---|
| Standard | 27.03 | 27.57 | 28.33 | 28.87 | 29.63 | 30.17 | 30.93 |
| Camarilla | 28.74 | 28.86 | 28.98 | 29.10 | 29.22 | 29.34 | 29.46 |
| Woodie | 27.15 | 27.63 | 28.45 | 28.93 | 29.75 | 30.23 | 31.05 |
| Fibonacci | 27.57 | 28.06 | 28.37 | 28.87 | 29.36 | 29.67 | 30.17 |
| Pivot points | S3 | S2 | S1 | PP | R1 | R2 | R3 |
|---|---|---|---|---|---|---|---|
| Standard | 23.48 | 26.22 | 28.03 | 30.77 | 32.58 | 35.32 | 37.13 |
| Camarilla | 28.60 | 29.02 | 29.43 | 29.85 | 30.27 | 30.68 | 31.10 |
| Woodie | 23.03 | 25.99 | 27.58 | 30.54 | 32.13 | 35.09 | 36.68 |
| Fibonacci | 26.22 | 27.96 | 29.03 | 30.77 | 32.51 | 33.58 | 35.32 |
| Pivot points | S3 | S2 | S1 | PP | R1 | R2 | R3 |
|---|---|---|---|---|---|---|---|
| Standard | 28.53 | 31.27 | 34.53 | 37.27 | 40.53 | 43.27 | 46.53 |
| Camarilla | 36.15 | 36.70 | 37.25 | 37.80 | 38.35 | 38.90 | 39.45 |
| Woodie | 28.80 | 31.40 | 34.80 | 37.40 | 40.80 | 43.40 | 46.80 |
| Fibonacci | 31.27 | 33.56 | 34.98 | 37.27 | 39.56 | 40.98 | 43.27 |
Numerical data
The following are the details of the technical indicators and moving averages that were collected to generate this technical analysis:
| RSI (14): | 31.59 | |
| MACD (12,26,9): | -2.8900 | |
| Directional Movement: | -15.18 | |
| AROON (14): | -28.57 | |
| DEMA (21): | 32.23 | |
| Parabolic SAR (0,02-0,02-0,2): | 39.56 | |
| Elder Ray (13): | -5.13 | |
| Super Trend (3,10): | 39.70 | |
| Zig ZAG (10): | 29.10 | |
| VORTEX (21): | 0.7600 | |
| Stochastique (14,3,5): | 9.40 | |
| TEMA (21): | 30.64 | |
| Williams %R (14): | -91.60 | |
| Chande Momentum Oscillator (20): | -5.90 | |
| Repulse (5,40,3): | -17.6900 | |
| ROCnROLL: | 2 | |
| TRIX (15,9): | -0.8900 | |
| Courbe Coppock: | 24.63 |
| MA7: | 29.79 | |
| MA20: | 32.59 | |
| MA50: | 34.68 | |
| MA100: | 36.52 | |
| MAexp7: | 32.50 | |
| MAexp20: | 35.81 | |
| MAexp50: | 39.22 | |
| MAexp100: | 39.78 | |
| Price / MA7: | -2.65% | |
| Price / MA20: | -11.02% | |
| Price / MA50: | -16.38% | |
| Price / MA100: | -20.59% | |
| Price / MAexp7: | -10.77% | |
| Price / MAexp20: | -19.02% | |
| Price / MAexp50: | -26.06% | |
| Price / MAexp100: | -27.10% |
News
The latest news and videos published on FRANCAISE ENERGIE at the time of the analysis were as follows:
- FDE buys back some of its share issued capital via its buy-back program
- FDE buys back some of its share issued capital via its buy-back program
- FDE buys back some of its share issued capital via its buy-back program
- FDE buys back some of its share issued capital via its buy-back program
- FDE buys back some of its share issued capital via its buy-back program
About author

Online


Add a comment
Comments
0 comments on the analysis FRANCAISE ENERGIE - Weekly