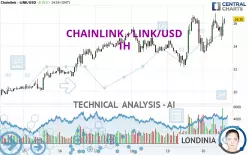
CHAINLINK - LINK/USD - 1H - Technical analysis published on 01/20/2025 (GMT)
- 97
- 0
Click here for a new analysis!
- Timeframe : 1H
- - Analysis generated on
- Status : INVALID

Summary of the analysis

Additional analysis
Quotes
CHAINLINK - LINK/USD rating 26.35 USD. The price registered an increase of +8.35% on the session and was traded between 23.38 USD and 26.89 USD over the period. The price is currently at +12.70% from its lowest and -2.01% from its highest.The Central Gaps scanner detects a bullish opening. A small advantage for buyers in the very short term.
Bullish opening
Type : Bullish
Timeframe : Openning
So that you have an overall view of the price change, here is a table showing the variations over several periods:
New HIGH record (1st january)
Type : Bullish
Timeframe : Weekly
New HIGH record (1 month)
Type : Bullish
Timeframe : Weekly
The Central Volumes scanner detects abnormal volumes on the asset:
Abnormal volumes
Timeframe : 50 days
Technical
A technical analysis in 1H of this CHAINLINK - LINK/USD chart shows a strongly bullish trend. 89.29% of the signals given by moving averages are bullish. The slightly bullish signals given by the short-term moving averages indicate this trend is showing signs of running out of steam. The Central Indicators scanner does not detect any result on moving averages that would impact this trend.
The probability of a further increase is high given the direction of the technical indicators.
The Central Indicators scanner found no further results concerning independent technical indicators.
The Central Patterns scanner, which studies chart patterns, resistances and supports, has identified this signal:
Near horizontal resistance
Type : Bearish
Timeframe : 1 hour
For a small setback in the very short term, the Central Candlesticks scanner currently notes the presence of this bearish pattern in Japanese candlesticks:
Bearish harami
Type : Bearish
Timeframe : 1 hour
Bearish harami cross
Type : Bearish
Timeframe : 1 hour
| S3 | S2 | S1 | Price | R1 | |
|---|---|---|---|---|---|
| ProTrendLines | 21.73 | 23.85 | 25.37 | 26.35 | 29.22 |
| Change (%) | -17.53% | -9.49% | -3.72% | - | +10.89% |
| Change | -4.62 | -2.50 | -0.98 | - | +2.87 |
| Level | Major | Major | Minor | - | Intermediate |
Pivot points can also be used to set your price objectives. Here is the price situation in relation to pivot points:
| Pivot points | S3 | S2 | S1 | PP | R1 | R2 | R3 |
|---|---|---|---|---|---|---|---|
| Standard | 17.49 | 19.83 | 22.07 | 24.41 | 26.65 | 28.99 | 31.23 |
| Camarilla | 23.06 | 23.48 | 23.90 | 24.32 | 24.74 | 25.16 | 25.58 |
| Woodie | 17.45 | 19.81 | 22.03 | 24.39 | 26.61 | 28.97 | 31.19 |
| Fibonacci | 19.83 | 21.58 | 22.66 | 24.41 | 26.16 | 27.24 | 28.99 |
| Pivot points | S3 | S2 | S1 | PP | R1 | R2 | R3 |
|---|---|---|---|---|---|---|---|
| Standard | 11.58 | 14.71 | 19.40 | 22.53 | 27.22 | 30.35 | 35.04 |
| Camarilla | 21.93 | 22.65 | 23.36 | 24.08 | 24.80 | 25.51 | 26.23 |
| Woodie | 12.35 | 15.10 | 20.17 | 22.92 | 27.99 | 30.74 | 35.81 |
| Fibonacci | 14.71 | 17.70 | 19.55 | 22.53 | 25.52 | 27.37 | 30.35 |
| Pivot points | S3 | S2 | S1 | PP | R1 | R2 | R3 |
|---|---|---|---|---|---|---|---|
| Standard | 3.07 | 10.84 | 15.40 | 23.17 | 27.73 | 35.50 | 40.06 |
| Camarilla | 16.58 | 17.71 | 18.84 | 19.97 | 21.10 | 22.23 | 23.36 |
| Woodie | 1.48 | 10.04 | 13.81 | 22.37 | 26.14 | 34.70 | 38.47 |
| Fibonacci | 10.84 | 15.55 | 18.46 | 23.17 | 27.88 | 30.79 | 35.50 |
Numerical data
The following are the details of the technical indicators and moving averages that were collected to generate this technical analysis:
| RSI (14): | 58.61 | |
| MACD (12,26,9): | 0.3800 | |
| Directional Movement: | 7.13 | |
| AROON (14): | 50.00 | |
| DEMA (21): | 25.65 | |
| Parabolic SAR (0,02-0,02-0,2): | 24.51 | |
| Elder Ray (13): | 0.68 | |
| Super Trend (3,10): | 26.38 | |
| Zig ZAG (10): | 26.10 | |
| VORTEX (21): | 0.9900 | |
| Stochastique (14,3,5): | 64.39 | |
| TEMA (21): | 25.86 | |
| Williams %R (14): | -23.65 | |
| Chande Momentum Oscillator (20): | 2.06 | |
| Repulse (5,40,3): | 2.2600 | |
| ROCnROLL: | 1 | |
| TRIX (15,9): | 0.1900 | |
| Courbe Coppock: | 9.33 |
| MA7: | 23.61 | |
| MA20: | 22.21 | |
| MA50: | 23.53 | |
| MA100: | 18.51 | |
| MAexp7: | 25.71 | |
| MAexp20: | 25.20 | |
| MAexp50: | 24.66 | |
| MAexp100: | 23.95 | |
| Price / MA7: | +11.61% | |
| Price / MA20: | +18.64% | |
| Price / MA50: | +11.98% | |
| Price / MA100: | +42.36% | |
| Price / MAexp7: | +2.49% | |
| Price / MAexp20: | +4.56% | |
| Price / MAexp50: | +6.85% | |
| Price / MAexp100: | +10.02% |
About author

Online


Add a comment
Comments
0 comments on the analysis CHAINLINK - LINK/USD - 1H