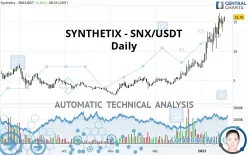
SYNTHETIX - SNX/USDT - Daily - Technical analysis published on 01/16/2021 (GMT)
- 249
- 0
- Timeframe : Daily
- - Analysis generated on
- Status : WITHOUT TARGET

Summary of the analysis

Additional analysis
Quotes
SYNTHETIX - SNX/USDT rating 15.79 USDT. On the day, this instrument gained +4.36% and was traded between 14.96 USDT and 15.90 USDT over the period. The price is currently at +5.55% from its lowest and -0.69% from its highest.The Central Gaps scanner detects a bullish opening. A small advantage for buyers in the very short term.
Bullish opening
Type : Bullish
Timeframe : Openning
So that you have an overall view of the price change, here is a table showing the variations over several periods:
Near a new HIGH record (1st january)
Type : Bullish
Timeframe : Weekly
Near a new HIGH record (1 month)
Type : Bullish
Timeframe : Weekly
The Central Volumes scanner detects abnormal volumes on the asset:
Abnormal volumes
Timeframe : 50 days
Technical
A technical analysis in Daily of this SYNTHETIX - SNX/USDT chart shows a strongly bullish trend. The signals given by the moving averages are 92.86% bullish. This strong bullish trend is confirmed by the strong signals currently being given by short-term moving averages. The Central Indicators scanner does not detect any result on moving averages that would impact this trend.
Technical indicators are strongly bullish, suggesting that the price increase should continue.
Caution: the Central Indicators scanner currently detects an excess:
RSI indicator is overbought : over 70
Type : Neutral
Timeframe : Daily
Williams %R indicator is overbought : over -20
Type : Neutral
Timeframe : Daily
Pivot points : price is over resistance 1
Type : Neutral
Timeframe : Weekly
Central Patterns, the scanner specializing in chart patterns, did not identify any signals.
The presence of a bullish Japanese candlestick pattern detected by Central Candlesticks that could cause a very short term rebound was also detected:
Bullish harami
Type : Bullish
Timeframe : Daily
| S3 | S2 | S1 | Price | |
|---|---|---|---|---|
| ProTrendLines | 5.33 | 7.29 | 12.40 | 15.79 |
| Change (%) | -66.24% | -53.83% | -21.47% | - |
| Change | -10.46 | -8.50 | -3.39 | - |
| Level | Minor | Major | Major | - |
Attention could also be paid to pivot points to set price objectives:
| Pivot points | S3 | S2 | S1 | PP | R1 | R2 | R3 |
|---|---|---|---|---|---|---|---|
| Standard | 11.56 | 12.44 | 13.78 | 14.66 | 16.00 | 16.88 | 18.22 |
| Camarilla | 14.52 | 14.72 | 14.93 | 15.13 | 15.33 | 15.54 | 15.74 |
| Woodie | 11.80 | 12.56 | 14.02 | 14.78 | 16.24 | 17.00 | 18.46 |
| Fibonacci | 12.44 | 13.29 | 13.81 | 14.66 | 15.51 | 16.03 | 16.88 |
| Pivot points | S3 | S2 | S1 | PP | R1 | R2 | R3 |
|---|---|---|---|---|---|---|---|
| Standard | 3.56 | 5.78 | 9.44 | 11.66 | 15.32 | 17.54 | 21.20 |
| Camarilla | 11.48 | 12.02 | 12.56 | 13.10 | 13.64 | 14.18 | 14.72 |
| Woodie | 4.28 | 6.14 | 10.16 | 12.02 | 16.04 | 17.90 | 21.92 |
| Fibonacci | 5.78 | 8.03 | 9.42 | 11.66 | 13.91 | 15.29 | 17.54 |
| Pivot points | S3 | S2 | S1 | PP | R1 | R2 | R3 |
|---|---|---|---|---|---|---|---|
| Standard | 0.04 | 2.09 | 4.66 | 6.71 | 9.29 | 11.34 | 13.91 |
| Camarilla | 5.96 | 6.39 | 6.81 | 7.23 | 7.66 | 8.08 | 8.51 |
| Woodie | 0.30 | 2.22 | 4.92 | 6.84 | 9.55 | 11.47 | 14.17 |
| Fibonacci | 2.09 | 3.86 | 4.95 | 6.71 | 8.48 | 9.57 | 11.34 |
Numerical data
The following is the status of technical indicators and moving averages registered at the time this technical analysis was created:
| RSI (14): | 74.47 | |
| MACD (12,26,9): | 2.2200 | |
| Directional Movement: | 11.60 | |
| AROON (14): | 71.43 | |
| DEMA (21): | 14.95 | |
| Parabolic SAR (0,02-0,02-0,2): | 12.92 | |
| Elder Ray (13): | 2.09 | |
| Super Trend (3,10): | 9.26 | |
| Zig ZAG (10): | 15.66 | |
| VORTEX (21): | 1.1900 | |
| Stochastique (14,3,5): | 84.83 | |
| TEMA (21): | 15.94 | |
| Williams %R (14): | -10.73 | |
| Chande Momentum Oscillator (20): | 4.09 | |
| Repulse (5,40,3): | 12.0200 | |
| ROCnROLL: | 1 | |
| TRIX (15,9): | 3.4800 | |
| Courbe Coppock: | 144.43 |
| MA7: | 14.69 | |
| MA20: | 11.58 | |
| MA50: | 7.99 | |
| MA100: | 6.00 | |
| MAexp7: | 14.56 | |
| MAexp20: | 12.15 | |
| MAexp50: | 9.16 | |
| MAexp100: | 7.19 | |
| Price / MA7: | +7.49% | |
| Price / MA20: | +36.36% | |
| Price / MA50: | +97.62% | |
| Price / MA100: | +163.17% | |
| Price / MAexp7: | +8.45% | |
| Price / MAexp20: | +29.96% | |
| Price / MAexp50: | +72.38% | |
| Price / MAexp100: | +119.61% |
About author

Online


Add a comment
Comments
0 comments on the analysis SYNTHETIX - SNX/USDT - Daily