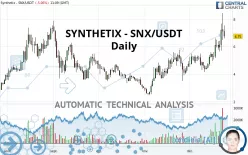
SYNTHETIX - SNX/USDT - Daily - Technical analysis published on 12/24/2020 (GMT)
- 276
- 0
Click here for a new analysis!
- Timeframe : Daily
- - Analysis generated on
- Status : TARGET REACHED

Summary of the analysis

Additional analysis
Quotes
SYNTHETIX - SNX/USDT rating 6.75 USDT. On the day, this instrument lost -5.06% with the lowest point at 6.59 USDT and the highest point at 7.55 USDT. The deviation from the price is +2.43% for the low point and -10.60% for the high point.The Central Gaps scanner detects a bearish opening marking the presence of sellers ahead of buyers at the opening but not sufficiently marked to allow the price to register a quotation gap.
Bearish opening
Type : Bearish
Timeframe : Openning
Here is a more detailed summary of the historical variations registered by SYNTHETIX - SNX/USDT:
Abnormal volumes
Timeframe : 5 days
Abnormal volumes
Timeframe : 20 days
Abnormal volumes
Timeframe : 50 days
Technical
Technical analysis of this Daily chart of SYNTHETIX - SNX/USDT indicates that the overall trend is strongly bullish. 92.86% of the signals given by moving averages are bullish. The overall trend is supported by the strong bullish signals from short-term moving averages. An assessment of moving averages reveals a bullish signal that could impact this trend:
Moving Average bullish crossovers : AMA50 & AMA100
Type : Bullish
Timeframe : Daily
The probability of a further increase is high given the direction of the technical indicators.
But beware of excesses. The Central Indicators scanner currently detects this:
RSI indicator is overbought : over 70
Type : Neutral
Timeframe : Daily
CCI indicator is overbought : over 100
Type : Neutral
Timeframe : Daily
Previous candle closed over Bollinger bands
Type : Neutral
Timeframe : Daily
CCI indicator: bearish divergence
Type : Bearish
Timeframe : Daily
Williams %R indicator is overbought : over -20
Type : Neutral
Timeframe : Daily
Price is back over the pivot point
Type : Bullish
Timeframe : Weekly
The Central Patterns scanner, which studies chart patterns, resistances and supports, has identified these signals:
Horizontal resistance is broken
Type : Bullish
Timeframe : Daily
Resistance of channel is broken
Type : Bullish
Timeframe : Daily
Resistance of triangle is broken
Type : Bullish
Timeframe : Daily
The Central Candlesticks scanner, specialised in Japanese candlesticks, did not identify any signals.
| S3 | S2 | S1 | Price | R1 | |
|---|---|---|---|---|---|
| ProTrendLines | 3.62 | 5.25 | 6.14 | 6.75 | 7.34 |
| Change (%) | -46.37% | -22.22% | -9.04% | - | +8.74% |
| Change | -3.13 | -1.50 | -0.61 | - | +0.59 |
| Level | Intermediate | Major | Minor | - | Intermediate |
To determine price objectives, it is also possible to use the pivot points. Here is the price position in relation to pivot points:
| Pivot points | S3 | S2 | S1 | PP | R1 | R2 | R3 |
|---|---|---|---|---|---|---|---|
| Standard | 4.29 | 5.39 | 6.25 | 7.35 | 8.21 | 9.31 | 10.17 |
| Camarilla | 6.58 | 6.75 | 6.93 | 7.11 | 7.29 | 7.47 | 7.65 |
| Woodie | 4.18 | 5.33 | 6.13 | 7.29 | 8.09 | 9.25 | 10.05 |
| Fibonacci | 5.39 | 6.14 | 6.60 | 7.35 | 8.10 | 8.56 | 9.31 |
| Pivot points | S3 | S2 | S1 | PP | R1 | R2 | R3 |
|---|---|---|---|---|---|---|---|
| Standard | 2.61 | 3.50 | 4.81 | 5.71 | 7.02 | 7.91 | 9.22 |
| Camarilla | 5.52 | 5.72 | 5.92 | 6.12 | 6.33 | 6.53 | 6.73 |
| Woodie | 2.82 | 3.61 | 5.02 | 5.81 | 7.23 | 8.01 | 9.43 |
| Fibonacci | 3.50 | 4.35 | 4.87 | 5.71 | 6.55 | 7.07 | 7.91 |
| Pivot points | S3 | S2 | S1 | PP | R1 | R2 | R3 |
|---|---|---|---|---|---|---|---|
| Standard | -0.42 | 1.02 | 2.88 | 4.33 | 6.19 | 7.63 | 9.49 |
| Camarilla | 3.83 | 4.14 | 4.44 | 4.74 | 5.05 | 5.35 | 5.65 |
| Woodie | -0.21 | 1.13 | 3.09 | 4.43 | 6.39 | 7.73 | 9.70 |
| Fibonacci | 1.02 | 2.28 | 3.06 | 4.33 | 5.59 | 6.37 | 7.63 |
Numerical data
The following are the details of the technical indicators and moving averages that were collected to generate this technical analysis:
| RSI (14): | 67.28 | |
| MACD (12,26,9): | 0.5700 | |
| Directional Movement: | 20.79 | |
| AROON (14): | 85.72 | |
| DEMA (21): | 6.41 | |
| Parabolic SAR (0,02-0,02-0,2): | 5.72 | |
| Elder Ray (13): | 1.01 | |
| Super Trend (3,10): | 4.82 | |
| Zig ZAG (10): | 6.78 | |
| VORTEX (21): | 1.1000 | |
| Stochastique (14,3,5): | 72.44 | |
| TEMA (21): | 6.72 | |
| Williams %R (14): | -39.62 | |
| Chande Momentum Oscillator (20): | 2.27 | |
| Repulse (5,40,3): | -5.1000 | |
| ROCnROLL: | 1 | |
| TRIX (15,9): | 1.0900 | |
| Courbe Coppock: | 69.63 |
| MA7: | 6.52 | |
| MA20: | 5.50 | |
| MA50: | 4.91 | |
| MA100: | 4.46 | |
| MAexp7: | 6.53 | |
| MAexp20: | 5.76 | |
| MAexp50: | 5.10 | |
| MAexp100: | 4.68 | |
| Price / MA7: | +3.53% | |
| Price / MA20: | +22.73% | |
| Price / MA50: | +37.47% | |
| Price / MA100: | +51.35% | |
| Price / MAexp7: | +3.37% | |
| Price / MAexp20: | +17.19% | |
| Price / MAexp50: | +32.35% | |
| Price / MAexp100: | +44.23% |
About author

Online


Add a comment
Comments
0 comments on the analysis SYNTHETIX - SNX/USDT - Daily