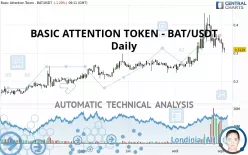
BASIC ATTENTION TOKEN - BAT/USDT - Daily - Technical analysis published on 09/03/2020 (GMT)
- 247
- 0
- Who voted?
Click here for a new analysis!
- Timeframe : Daily
- - Analysis generated on
- Status : INVALID

Summary of the analysis

Additional analysis
Quotes
The BASIC ATTENTION TOKEN - BAT/USDT rating is 0.312900 USDT. The price registered a decrease of -1.20% on the session and was between 0.301500 USDT and 0.320100 USDT. This implies that the price is at +3.78% from its lowest and at -2.25% from its highest.The Central Gaps scanner detects a bullish opening. A small advantage for buyers in the very short term.
Bullish opening
Type : Bullish
Timeframe : Openning
A study of price movements over other periods shows the following variations:
Abnormal volumes
Timeframe : 5 days
Abnormal volumes
Timeframe : 20 days
Abnormal volumes
Timeframe : 50 days
Technical
Technical analysis of BASIC ATTENTION TOKEN - BAT/USDT in Daily shows an overall bullish trend. The signals given by moving averages are 75.00% bullish. This bullish trend could slow down given the neutral signals currently being given by short-term moving averages. The Central Indicators market scanner is currently detecting a bearish signal that could impact this trend:
Bearish price crossover with adaptative moving average 20
Type : Bearish
Timeframe : Daily
In fact, according to the parameters integrated into the Central Analyzer system, 10 technical indicators out of 18 analysed are currently bearish. Caution: the Central Indicators scanner currently detects an excess:
Williams %R indicator is oversold : under -80
Type : Neutral
Timeframe : Daily
RSI indicator is back under 50
Type : Bearish
Timeframe : Daily
Aroon indicator bearish trend
Type : Bearish
Timeframe : Daily
Price is back over the pivot point
Type : Bullish
Timeframe : Weekly
Price is back under the pivot point
Type : Bearish
Timeframe : Daily
Price is back under the pivot point
Type : Bearish
Timeframe : Weekly
The Central Patterns scanner, which studies chart patterns, resistances and supports, has identified these signals:
Near horizontal support
Type : Bullish
Timeframe : Daily
Support of channel is broken
Type : Bearish
Timeframe : Daily
The Central Candlesticks scanner, specialised in Japanese candlesticks, did not identify any signals.
| S3 | S2 | S1 | Price | R1 | R2 | R3 | |
|---|---|---|---|---|---|---|---|
| ProTrendLines | 0.154511 | 0.242625 | 0.311000 | 0.312900 | 0.402500 | 0.437200 | 0.860700 |
| Change (%) | -50.62% | -22.46% | -0.61% | - | +28.64% | +39.73% | +175.07% |
| Change | -0.158389 | -0.070275 | -0.001900 | - | +0.089600 | +0.124300 | +0.547800 |
| Level | Minor | Major | Major | - | Intermediate | Intermediate | Minor |
To determine price objectives, it is also possible to use the pivot points. Here is the price position in relation to pivot points:
| Pivot points | S3 | S2 | S1 | PP | R1 | R2 | R3 |
|---|---|---|---|---|---|---|---|
| Standard | 0.263933 | 0.283367 | 0.300033 | 0.319467 | 0.336133 | 0.355567 | 0.372233 |
| Camarilla | 0.306773 | 0.310082 | 0.313391 | 0.316700 | 0.320009 | 0.323318 | 0.326628 |
| Woodie | 0.262550 | 0.282675 | 0.298650 | 0.318775 | 0.334750 | 0.354875 | 0.370850 |
| Fibonacci | 0.283367 | 0.297157 | 0.305677 | 0.319467 | 0.333257 | 0.341777 | 0.355567 |
| Pivot points | S3 | S2 | S1 | PP | R1 | R2 | R3 |
|---|---|---|---|---|---|---|---|
| Standard | 0.183367 | 0.250433 | 0.301067 | 0.368133 | 0.418767 | 0.485833 | 0.536467 |
| Camarilla | 0.319333 | 0.330122 | 0.340911 | 0.351700 | 0.362489 | 0.373278 | 0.384068 |
| Woodie | 0.175150 | 0.246325 | 0.292850 | 0.364025 | 0.410550 | 0.481725 | 0.528250 |
| Fibonacci | 0.250433 | 0.295395 | 0.323172 | 0.368133 | 0.413095 | 0.440872 | 0.485833 |
| Pivot points | S3 | S2 | S1 | PP | R1 | R2 | R3 |
|---|---|---|---|---|---|---|---|
| Standard | 0.026633 | 0.128567 | 0.238233 | 0.340167 | 0.449833 | 0.551767 | 0.661433 |
| Camarilla | 0.289710 | 0.309107 | 0.328503 | 0.347900 | 0.367297 | 0.386693 | 0.406090 |
| Woodie | 0.030500 | 0.130500 | 0.242100 | 0.342100 | 0.453700 | 0.553700 | 0.665300 |
| Fibonacci | 0.128567 | 0.209398 | 0.259336 | 0.340167 | 0.420998 | 0.470936 | 0.551767 |
Numerical data
The following is the status of the technical indicators and moving averages at the time of publication of this technical analysis:
| RSI (14): | 45.56 | |
| MACD (12,26,9): | 0.0100 | |
| Directional Movement: | -0.908968 | |
| AROON (14): | -92.857143 | |
| DEMA (21): | 0.349288 | |
| Parabolic SAR (0,02-0,02-0,2): | 0.405227 | |
| Elder Ray (13): | -0.025281 | |
| Super Trend (3,10): | 0.285599 | |
| Zig ZAG (10): | 0.310600 | |
| VORTEX (21): | 1.0524 | |
| Stochastique (14,3,5): | 11.59 | |
| TEMA (21): | 0.343451 | |
| Williams %R (14): | -93.88 | |
| Chande Momentum Oscillator (20): | -0.088400 | |
| Repulse (5,40,3): | -8.7866 | |
| ROCnROLL: | -1 | |
| TRIX (15,9): | 0.9472 | |
| Courbe Coppock: | 0.37 |
| MA7: | 0.336729 | |
| MA20: | 0.344655 | |
| MA50: | 0.294304 | |
| MA100: | 0.268249 | |
| MAexp7: | 0.331732 | |
| MAexp20: | 0.331494 | |
| MAexp50: | 0.304497 | |
| MAexp100: | 0.275189 | |
| Price / MA7: | -7.08% | |
| Price / MA20: | -9.21% | |
| Price / MA50: | +6.32% | |
| Price / MA100: | +16.65% | |
| Price / MAexp7: | -5.68% | |
| Price / MAexp20: | -5.61% | |
| Price / MAexp50: | +2.76% | |
| Price / MAexp100: | +13.70% |
About author

Online


Add a comment
Comments
0 comments on the analysis BASIC ATTENTION TOKEN - BAT/USDT - Daily