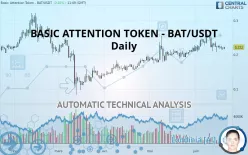
BASIC ATTENTION TOKEN - BAT/USDT - Daily - Technical analysis published on 06/20/2020 (GMT)
- 334
- 0
- Who voted?
Click here for a new analysis!
- Timeframe : Daily
- - Analysis generated on
- Status : TARGET REACHED

Summary of the analysis

Additional analysis
Quotes
BASIC ATTENTION TOKEN - BAT/USDT rating 0.222000 USDT. The price registered an increase of +2.02% on the session and was between 0.216100 USDT and 0.223400 USDT. This implies that the price is at +2.73% from its lowest and at -0.63% from its highest.A bullish opening was detected by the Central Gaps scanner. Buyers are trying to impose a bullish momentum in the very short term.
Bullish opening
Type : Bullish
Timeframe : Openning
So that you have an overall view of the price change, here is a table showing the variations over several periods:
Technical
A technical analysis in Daily of this BASIC ATTENTION TOKEN - BAT/USDT chart shows a bullish trend. 75.00% of the signals given by moving averages are bullish. Caution: the neutral signals currently given by short-term moving averages show us that the global trend is losing momentum. The Central Indicators scanner does not detect any result on moving averages that would impact this trend.
On the 18 technical indicators analysed, 4 are bullish, 9 are neutral and 5 are bearish. But beware of excesses. The Central Indicators scanner currently detects this:
Williams %R indicator is oversold : under -80
Type : Neutral
Timeframe : Daily
Pivot points : price is over resistance 1
Type : Neutral
Timeframe : Daily
Price is back under the pivot point
Type : Bearish
Timeframe : Daily
Price is back under the pivot point
Type : Bearish
Timeframe : Weekly
An analysis of the price chart with the Central Patterns scanner (detector of chart patterns and resistances and supports) shows several results that can have an impact on the price change:
Near horizontal support
Type : Bullish
Timeframe : Daily
Near support of triangle
Type : Bullish
Timeframe : Daily
Support of channel is broken
Type : Bearish
Timeframe : Daily
No result was found by the Central Candlesticks scanner on Japanese candlesticks.
| S3 | S2 | S1 | Price | R1 | R2 | R3 | |
|---|---|---|---|---|---|---|---|
| ProTrendLines | 0.130400 | 0.154467 | 0.194500 | 0.222000 | 0.227900 | 0.256233 | 0.281800 |
| Change (%) | -41.26% | -30.42% | -12.39% | - | +2.66% | +15.42% | +26.94% |
| Change | -0.091600 | -0.067533 | -0.027500 | - | +0.005900 | +0.034233 | +0.059800 |
| Level | Minor | Intermediate | Major | - | Intermediate | Major | Minor |
Pivot points can also be used to set your price objectives. Here is the price situation in relation to pivot points:
| Pivot points | S3 | S2 | S1 | PP | R1 | R2 | R3 |
|---|---|---|---|---|---|---|---|
| Standard | 0.206467 | 0.210333 | 0.213967 | 0.217833 | 0.221467 | 0.225333 | 0.228967 |
| Camarilla | 0.215538 | 0.216225 | 0.216913 | 0.217600 | 0.218288 | 0.218975 | 0.219663 |
| Woodie | 0.206350 | 0.210275 | 0.213850 | 0.217775 | 0.221350 | 0.225275 | 0.228850 |
| Fibonacci | 0.210333 | 0.213198 | 0.214968 | 0.217833 | 0.220698 | 0.222468 | 0.225333 |
| Pivot points | S3 | S2 | S1 | PP | R1 | R2 | R3 |
|---|---|---|---|---|---|---|---|
| Standard | 0.160233 | 0.185467 | 0.208933 | 0.234167 | 0.257633 | 0.282867 | 0.306333 |
| Camarilla | 0.219008 | 0.223472 | 0.227936 | 0.232400 | 0.236864 | 0.241328 | 0.245793 |
| Woodie | 0.159350 | 0.185025 | 0.208050 | 0.233725 | 0.256750 | 0.282425 | 0.305450 |
| Fibonacci | 0.185467 | 0.204070 | 0.215563 | 0.234167 | 0.252770 | 0.264263 | 0.282867 |
| Pivot points | S3 | S2 | S1 | PP | R1 | R2 | R3 |
|---|---|---|---|---|---|---|---|
| Standard | 0.092100 | 0.133300 | 0.172300 | 0.213500 | 0.252500 | 0.293700 | 0.332700 |
| Camarilla | 0.189245 | 0.196597 | 0.203948 | 0.211300 | 0.218652 | 0.226003 | 0.233355 |
| Woodie | 0.091000 | 0.132750 | 0.171200 | 0.212950 | 0.251400 | 0.293150 | 0.331600 |
| Fibonacci | 0.133300 | 0.163936 | 0.182864 | 0.213500 | 0.244136 | 0.263064 | 0.293700 |
Numerical data
The following is the status of the technical indicators and moving averages at the time of publication of this technical analysis:
| RSI (14): | 48.70 | |
| MACD (12,26,9): | 0.0021 | |
| Directional Movement: | -6.111508 | |
| AROON (14): | -42.857141 | |
| DEMA (21): | 0.229232 | |
| Parabolic SAR (0,02-0,02-0,2): | 0.247501 | |
| Elder Ray (13): | -0.005149 | |
| Super Trend (3,10): | 0.211323 | |
| Zig ZAG (10): | 0.220400 | |
| VORTEX (21): | 1.0287 | |
| Stochastique (14,3,5): | 21.75 | |
| TEMA (21): | 0.223849 | |
| Williams %R (14): | -74.32 | |
| Chande Momentum Oscillator (20): | -0.035300 | |
| Repulse (5,40,3): | 0.5888 | |
| ROCnROLL: | -1 | |
| TRIX (15,9): | 0.3892 | |
| Courbe Coppock: | 10.26 |
| MA7: | 0.221714 | |
| MA20: | 0.230675 | |
| MA50: | 0.213076 | |
| MA100: | 0.183234 | |
| MAexp7: | 0.222825 | |
| MAexp20: | 0.224379 | |
| MAexp50: | 0.213537 | |
| MAexp100: | 0.204057 | |
| Price / MA7: | +0.13% | |
| Price / MA20: | -3.76% | |
| Price / MA50: | +4.19% | |
| Price / MA100: | +21.16% | |
| Price / MAexp7: | -0.37% | |
| Price / MAexp20: | -1.06% | |
| Price / MAexp50: | +3.96% | |
| Price / MAexp100: | +8.79% |
About author

Online


Add a comment
Comments
0 comments on the analysis BASIC ATTENTION TOKEN - BAT/USDT - Daily