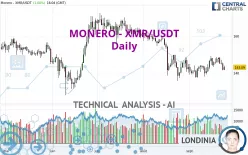
MONERO - XMR/USDT - Daily - Technical analysis published on 09/24/2023 (GMT)
- 208
- 0
Click here for a new analysis!
- Timeframe : Daily
- - Analysis generated on
- Status : INVALID

Summary of the analysis

Additional analysis
Quotes
The MONERO - XMR/USDT price is 143.09 USDT. The price has increased by +1.00% since the last closing and was between 141.52 USDT and 143.92 USDT. This implies that the price is at +1.11% from its lowest and at -0.58% from its highest.A bullish opening was detected by the Central Gaps scanner. Buyers are trying to impose a bullish momentum in the very short term.
Bullish opening
Type : Bullish
Timeframe : Openning
So that you have an overall view of the price change, here is a table showing the variations over several periods:
Near a new LOW record (1 month)
Type : Bearish
Timeframe : Weekly
Technical
Technical analysis of MONERO - XMR/USDT in Daily shows an overall bearish trend. The signals given by moving averages are at 78.57% bearish. This bearish trend shows slight signs of slowing down given the slightly bearish signals of short-term moving averages. The Central Indicators scanner detects bearish signals on moving averages that could impact this trend:
Bearish trend reversal : adaptative moving average 20
Type : Bearish
Timeframe : Daily
Bearish trend reversal : adaptative moving average 50
Type : Bearish
Timeframe : Daily
Bearish price crossover with adaptative moving average 20
Type : Bearish
Timeframe : Daily
The technical indicators are generally neutral. They do not provide relevant information on the direction of future price movements.
Caution: the Central Indicators scanner currently detects an excess:
RSI indicator: bullish divergence
Type : Bullish
Timeframe : Daily
Central Patterns, the scanner specializing in chart patterns, did not identify any signals.
For a small rebound in the very short term, the Central Candlesticks scanner currently notes the presence of this bullish pattern in Japanese candlesticks:
Bullish harami
Type : Bullish
Timeframe : Daily
| S3 | S2 | S1 | Price | R1 | R2 | R3 | |
|---|---|---|---|---|---|---|---|
| ProTrendLines | 134.66 | 137.68 | 141.61 | 143.09 | 151.07 | 155.18 | 163.75 |
| Change (%) | -5.89% | -3.78% | -1.03% | - | +5.58% | +8.45% | +14.44% |
| Change | -8.43 | -5.41 | -1.48 | - | +7.98 | +12.09 | +20.66 |
| Level | Major | Intermediate | Minor | - | Intermediate | Minor | Intermediate |
To determine price objectives, it is also possible to use the pivot points. Here is the price position in relation to pivot points:
| Pivot points | S3 | S2 | S1 | PP | R1 | R2 | R3 |
|---|---|---|---|---|---|---|---|
| Standard | 136.01 | 138.73 | 140.20 | 142.92 | 144.39 | 147.11 | 148.58 |
| Camarilla | 140.53 | 140.91 | 141.30 | 141.68 | 142.06 | 142.45 | 142.83 |
| Woodie | 135.40 | 138.42 | 139.59 | 142.61 | 143.78 | 146.80 | 147.97 |
| Fibonacci | 138.73 | 140.33 | 141.32 | 142.92 | 144.52 | 145.51 | 147.11 |
| Pivot points | S3 | S2 | S1 | PP | R1 | R2 | R3 |
|---|---|---|---|---|---|---|---|
| Standard | 132.11 | 136.77 | 139.23 | 143.89 | 146.35 | 151.01 | 153.47 |
| Camarilla | 139.72 | 140.38 | 141.03 | 141.68 | 142.33 | 142.99 | 143.64 |
| Woodie | 131.00 | 136.22 | 138.12 | 143.34 | 145.24 | 150.46 | 152.36 |
| Fibonacci | 136.77 | 139.49 | 141.17 | 143.89 | 146.61 | 148.29 | 151.01 |
| Pivot points | S3 | S2 | S1 | PP | R1 | R2 | R3 |
|---|---|---|---|---|---|---|---|
| Standard | 106.69 | 121.21 | 132.16 | 146.68 | 157.63 | 172.15 | 183.10 |
| Camarilla | 136.11 | 138.44 | 140.78 | 143.11 | 145.45 | 147.78 | 150.11 |
| Woodie | 104.91 | 120.32 | 130.38 | 145.79 | 155.85 | 171.26 | 181.32 |
| Fibonacci | 121.21 | 130.94 | 136.95 | 146.68 | 156.41 | 162.42 | 172.15 |
Numerical data
The following is the status of technical indicators and moving averages registered at the time this technical analysis was created:
| RSI (14): | 45.67 | |
| MACD (12,26,9): | -0.3800 | |
| Directional Movement: | -7.20 | |
| AROON (14): | 28.57 | |
| DEMA (21): | 143.72 | |
| Parabolic SAR (0,02-0,02-0,2): | 140.05 | |
| Elder Ray (13): | -1.69 | |
| Super Trend (3,10): | 152.47 | |
| Zig ZAG (10): | 142.81 | |
| VORTEX (21): | 1.0300 | |
| Stochastique (14,3,5): | 45.70 | |
| TEMA (21): | 145.13 | |
| Williams %R (14): | -57.56 | |
| Chande Momentum Oscillator (20): | 2.00 | |
| Repulse (5,40,3): | -2.4500 | |
| ROCnROLL: | 2 | |
| TRIX (15,9): | -0.0400 | |
| Courbe Coppock: | 3.73 |
| MA7: | 145.18 | |
| MA20: | 143.89 | |
| MA50: | 146.63 | |
| MA100: | 153.84 | |
| MAexp7: | 144.26 | |
| MAexp20: | 144.48 | |
| MAexp50: | 147.02 | |
| MAexp100: | 150.27 | |
| Price / MA7: | -1.44% | |
| Price / MA20: | -0.56% | |
| Price / MA50: | -2.41% | |
| Price / MA100: | -6.99% | |
| Price / MAexp7: | -0.81% | |
| Price / MAexp20: | -0.96% | |
| Price / MAexp50: | -2.67% | |
| Price / MAexp100: | -4.78% |
About author

Online


Add a comment
Comments
0 comments on the analysis MONERO - XMR/USDT - Daily