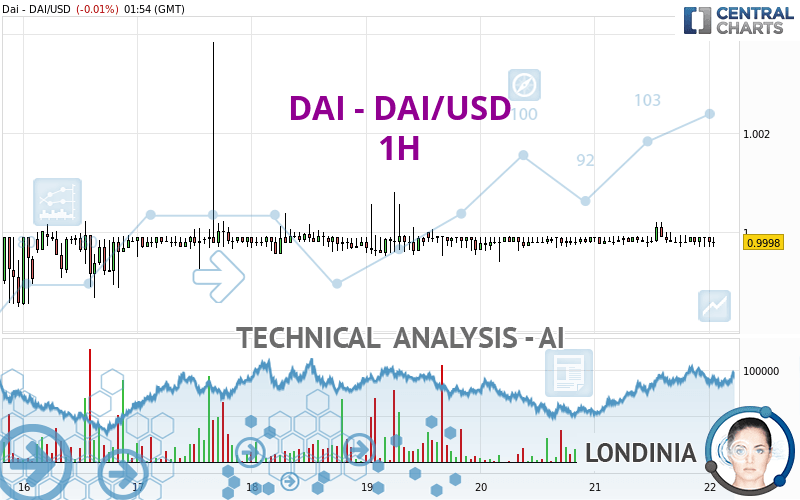
DAI - DAI/USD - 1H - Technical analysis published on 04/22/2024 (GMT)
- 98
- 0
Click here for a new analysis!
- Timeframe : 1H
- - Analysis generated on
- Status : LEVEL MAINTAINED

Summary of the analysis

Additional analysis
Quotes
The DAI - DAI/USD price is 0.999800 USD. On the day, this instrument lost -0.01% and was between 0.999695 USD and 0.999900 USD. This implies that the price is at +0.01% from its lowest and at -0.01% from its highest.A study of price movements over other periods shows the following variations:
Near a new HIGH record (1 year)
Type : Bullish
Timeframe : Weekly
Near a new HIGH record (1st january)
Type : Bullish
Timeframe : Weekly
Near a new HIGH record (1 month)
Type : Bullish
Timeframe : Weekly
Technical
Technical analysis of DAI - DAI/USD in 1H shows an overall bearish trend. 64.29% of the signals given by moving averages are bearish. The overall trend is reinforced by the strong bearish signals from short-term moving averages. The Central Indicators market scanner is currently detecting several bearish signals that could impact this trend:
Bearish trend reversal : Moving Average 20
Type : Bearish
Timeframe : 1 hour
Bearish trend reversal : adaptative moving average 20
Type : Bearish
Timeframe : 1 hour
Bearish trend reversal : adaptative moving average 50
Type : Bearish
Timeframe : 1 hour
Bearish trend reversal : adaptative moving average 100
Type : Bearish
Timeframe : 1 hour
Bearish price crossover with adaptative moving average 20
Type : Bearish
Timeframe : 1 hour
Technical indicators are slightly bearish. There is therefore considerable uncertainty about the continuation of the decline.
Caution: the Central Indicators scanner currently detects an excess:
Williams %R indicator is oversold : under -80
Type : Neutral
Timeframe : 1 hour
RSI indicator is back over 50
Type : Bullish
Timeframe : 1 hour
MACD crosses UP its Moving Average
Type : Bullish
Timeframe : 1 hour
An analysis of the price chart with the Central Patterns scanner (detector of chart patterns and resistances and supports) shows a result that can have an impact on the price change:
Near resistance of triangle
Type : Bearish
Timeframe : 1 hour
The Central Candlesticks scanner which studies Japanese candlesticks did not detect anything.
| S3 | S2 | S1 | Price | R1 | R2 | R3 | |
|---|---|---|---|---|---|---|---|
| ProTrendLines | 0.996400 | 0.998491 | 0.999530 | 0.999800 | 0.999993 | 1.001108 | 1.003000 |
| Change (%) | -0.34% | -0.13% | -0.03% | - | +0.02% | +0.13% | +0.32% |
| Change | -0.003400 | -0.001309 | -0.000270 | - | +0.000193 | +0.001308 | +0.003200 |
| Level | Minor | Minor | Intermediate | - | Major | Intermediate | Intermediate |
To determine price objectives, it is also possible to use the pivot points. Here is the price position in relation to pivot points:
| Pivot points | S3 | S2 | S1 | PP | R1 | R2 | R3 |
|---|---|---|---|---|---|---|---|
| Standard | 0.999166 | 0.999432 | 0.999666 | 0.999932 | 1.000166 | 1.000432 | 1.000666 |
| Camarilla | 0.999762 | 0.999807 | 0.999853 | 0.999899 | 0.999945 | 0.999991 | 1.000037 |
| Woodie | 0.999149 | 0.999424 | 0.999649 | 0.999924 | 1.000149 | 1.000424 | 1.000649 |
| Fibonacci | 0.999432 | 0.999623 | 0.999741 | 0.999932 | 1.000123 | 1.000241 | 1.000432 |
| Pivot points | S3 | S2 | S1 | PP | R1 | R2 | R3 |
|---|---|---|---|---|---|---|---|
| Standard | 0.992310 | 0.995401 | 0.997656 | 1.000747 | 1.003002 | 1.006093 | 1.008348 |
| Camarilla | 0.998442 | 0.998932 | 0.999422 | 0.999912 | 1.000402 | 1.000892 | 1.001382 |
| Woodie | 0.991893 | 0.995192 | 0.997239 | 1.000538 | 1.002585 | 1.005884 | 1.007931 |
| Fibonacci | 0.995401 | 0.997443 | 0.998705 | 1.000747 | 1.002789 | 1.004051 | 1.006093 |
| Pivot points | S3 | S2 | S1 | PP | R1 | R2 | R3 |
|---|---|---|---|---|---|---|---|
| Standard | 0.986079 | 0.991940 | 0.995934 | 1.001795 | 1.005789 | 1.011650 | 1.015644 |
| Camarilla | 0.997218 | 0.998121 | 0.999025 | 0.999928 | 1.000831 | 1.001735 | 1.002638 |
| Woodie | 0.985146 | 0.991473 | 0.995001 | 1.001328 | 1.004856 | 1.011183 | 1.014711 |
| Fibonacci | 0.991940 | 0.995705 | 0.998030 | 1.001795 | 1.005560 | 1.007885 | 1.011650 |
Numerical data
The following are the details of the technical indicators and moving averages that were collected to generate this technical analysis:
| RSI (14): | 44.77 | |
| MACD (12,26,9): | 0.0000 | |
| Directional Movement: | -6.360219 | |
| AROON (14): | -85.714286 | |
| DEMA (21): | 0.999831 | |
| Parabolic SAR (0,02-0,02-0,2): | 1.000107 | |
| Elder Ray (13): | -0.000034 | |
| Super Trend (3,10): | 1.000272 | |
| Zig ZAG (10): | 0.999737 | |
| VORTEX (21): | 0.9856 | |
| Stochastique (14,3,5): | 30.98 | |
| TEMA (21): | 0.999829 | |
| Williams %R (14): | -84.92 | |
| Chande Momentum Oscillator (20): | -0.000328 | |
| Repulse (5,40,3): | 0.0000 | |
| ROCnROLL: | 2 | |
| TRIX (15,9): | 0.0001 | |
| Courbe Coppock: | 0.01 |
| MA7: | 0.999838 | |
| MA20: | 0.999774 | |
| MA50: | 0.999865 | |
| MA100: | 0.999668 | |
| MAexp7: | 0.999860 | |
| MAexp20: | 0.999835 | |
| MAexp50: | 0.999830 | |
| MAexp100: | 0.999812 | |
| Price / MA7: | +0.00% | |
| Price / MA20: | +0.00% | |
| Price / MA50: | -0.01% | |
| Price / MA100: | +0.01% | |
| Price / MAexp7: | -0.01% | |
| Price / MAexp20: | +0.00% | |
| Price / MAexp50: | +0.00% | |
| Price / MAexp100: | +0.00% |
About author
Online


Add a comment
Comments
0 comments on the analysis DAI - DAI/USD - 1H