| Open: | - |
| Change: | - |
| Volume: | - |
| Low: | - |
| High: | - |
| High / Low range: | - |
| Type: | Cryptocurrencies |
| Ticker: | ZILUSD |
| ISIN: |
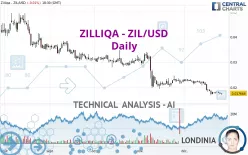
ZILLIQA - ZIL/USD - Daily - Technical analysis published on 12/26/2022 (GMT)
- 164
- 0
- 12/26/2022 - 18:35
Click here for a new analysis!
- Timeframe : Daily
- - Analysis generated on 12/26/2022 - 18:35
- Status : INVALID

Summary of the analysis

Additional analysis
Quotes
ZILLIQA - ZIL/USD rating 0.017664 USD. The price is lower by -0.01% since the last closing and was traded between 0.017005 USD and 0.017753 USD over the period. The price is currently at +3.88% from its lowest and -0.50% from its highest.The Central Gaps scanner detects a bearish opening marking the presence of sellers ahead of buyers at the opening but not sufficiently marked to allow the price to register a quotation gap.
Bearish opening
Type : Bearish
Timeframe : Openning
A study of price movements over other periods shows the following variations:
Near a new LOW record (1 year)
Type : Bearish
Timeframe : Weekly
Near a new LOW record (1 month)
Type : Bearish
Timeframe : Weekly
Technical
A technical analysis in Daily of this ZILLIQA - ZIL/USD chart shows a sharp bearish trend. The signals given by moving averages are 92.86% bearish. This strong bearish trend is confirmed by the strong signals currently being given by short-term moving averages. The Central Indicators scanner does not detect any result on moving averages that would impact this trend.
An assessment of technical indicators does not currently provide any relevant information to suggest whether the signal given by the technical indicators is more bullish or bearish.
Caution: the Central Indicators scanner currently detects an excess:
RSI indicator: bullish divergence
Type : Bullish
Timeframe : Daily
Williams %R indicator is oversold : under -80
Type : Neutral
Timeframe : Daily
Price is back over the pivot point
Type : Bullish
Timeframe : Daily
Central Patterns, the scanner specializing in chart patterns, did not identify any signals.
No result was found by the Central Candlesticks scanner on Japanese candlesticks.
| S1 | Price | R1 | R2 | R3 | |
|---|---|---|---|---|---|
| ProTrendLines | 0.015010 | 0.017664 | 0.022585 | 0.032888 | 0.037046 |
| Change (%) | -15.02% | - | +27.86% | +86.19% | +109.73% |
| Change | -0.002654 | - | +0.004921 | +0.015224 | +0.019382 |
| Level | Intermediate | - | Minor | Intermediate | Minor |
Attention could also be paid to pivot points to set price objectives:
| Pivot points | S3 | S2 | S1 | PP | R1 | R2 | R3 |
|---|---|---|---|---|---|---|---|
| Standard | 0.016488 | 0.016868 | 0.017267 | 0.017647 | 0.018046 | 0.018426 | 0.018825 |
| Camarilla | 0.017451 | 0.017522 | 0.017594 | 0.017665 | 0.017736 | 0.017808 | 0.017879 |
| Woodie | 0.016497 | 0.016873 | 0.017276 | 0.017652 | 0.018055 | 0.018431 | 0.018834 |
| Fibonacci | 0.016868 | 0.017166 | 0.017350 | 0.017647 | 0.017945 | 0.018129 | 0.018426 |
| Pivot points | S3 | S2 | S1 | PP | R1 | R2 | R3 |
|---|---|---|---|---|---|---|---|
| Standard | 0.014537 | 0.015719 | 0.016783 | 0.017965 | 0.019029 | 0.020211 | 0.021275 |
| Camarilla | 0.017230 | 0.017436 | 0.017642 | 0.017848 | 0.018054 | 0.018260 | 0.018466 |
| Woodie | 0.014479 | 0.015690 | 0.016725 | 0.017936 | 0.018971 | 0.020182 | 0.021217 |
| Fibonacci | 0.015719 | 0.016577 | 0.017107 | 0.017965 | 0.018823 | 0.019353 | 0.020211 |
| Pivot points | S3 | S2 | S1 | PP | R1 | R2 | R3 |
|---|---|---|---|---|---|---|---|
| Standard | 0.004096 | 0.011710 | 0.017355 | 0.024969 | 0.030614 | 0.038228 | 0.043873 |
| Camarilla | 0.019354 | 0.020569 | 0.021785 | 0.023000 | 0.024215 | 0.025431 | 0.026646 |
| Woodie | 0.003112 | 0.011218 | 0.016371 | 0.024477 | 0.029630 | 0.037736 | 0.042889 |
| Fibonacci | 0.011710 | 0.016775 | 0.019904 | 0.024969 | 0.030034 | 0.033163 | 0.038228 |
Numerical data
The following is the status of the technical indicators and moving averages at the time of publication of this technical analysis:
| RSI (14): | 32.15 | |
| MACD (12,26,9): | -0.0014 | |
| Directional Movement: | -24.994458 | |
| AROON (14): | -35.714286 | |
| DEMA (21): | 0.017634 | |
| Parabolic SAR (0,02-0,02-0,2): | 0.020768 | |
| Elder Ray (13): | -0.001341 | |
| Super Trend (3,10): | 0.020250 | |
| Zig ZAG (10): | 0.017600 | |
| VORTEX (21): | 0.7357 | |
| Stochastique (14,3,5): | 14.69 | |
| TEMA (21): | 0.017364 | |
| Williams %R (14): | -86.05 | |
| Chande Momentum Oscillator (20): | -0.004042 | |
| Repulse (5,40,3): | 1.4480 | |
| ROCnROLL: | 2 | |
| TRIX (15,9): | -0.8238 | |
| Courbe Coppock: | 37.19 |
| MA7: | 0.017912 | |
| MA20: | 0.019839 | |
| MA50: | 0.021513 | |
| MA100: | 0.026267 | |
| MAexp7: | 0.018047 | |
| MAexp20: | 0.019447 | |
| MAexp50: | 0.022087 | |
| MAexp100: | 0.026490 | |
| Price / MA7: | -1.38% | |
| Price / MA20: | -10.96% | |
| Price / MA50: | -17.89% | |
| Price / MA100: | -32.75% | |
| Price / MAexp7: | -2.12% | |
| Price / MAexp20: | -9.17% | |
| Price / MAexp50: | -20.03% | |
| Price / MAexp100: | -33.32% |
About author
Online


Add a comment
Comments
0 comments on the analysis ZILLIQA - ZIL/USD - Daily