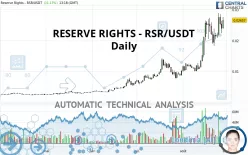
RESERVE RIGHTS - RSR/USDT - Daily - Technical analysis published on 08/28/2020 (GMT)
- 360
- 0
- Who voted?
- Timeframe : Daily
- - Analysis generated on
- Status : WITHOUT TARGET

Summary of the analysis

Additional analysis
Quotes
RESERVE RIGHTS - RSR/USDT rating 0.026570 USDT. On the day, this instrument gained +11.13% and was between 0.023860 USDT and 0.027620 USDT. This implies that the price is at +11.36% from its lowest and at -3.80% from its highest.The Central Gaps scanner detects a bullish opening. A small advantage for buyers in the very short term.
Bullish opening
Type : Bullish
Timeframe : Openning
A study of price movements over other periods shows the following variations:
Near a new HIGH record (1st january)
Type : Bullish
Timeframe : Weekly
Near a new HIGH record (1 month)
Type : Bullish
Timeframe : Weekly
Technical
Technical analysis of RESERVE RIGHTS - RSR/USDT in Daily shows a strongly overall bullish trend. The signals given by the moving averages are 92.86% bullish. This strong bullish trend is confirmed by the strong signals currently being given by short-term moving averages. The Central Indicators market scanner currently does not detect any result that concerns moving averages.
In fact, 13 technical indicators on 18 studied are currently bullish. Caution: the Central Indicators scanner currently detects an excess:
Williams %R indicator is overbought : over -20
Type : Neutral
Timeframe : Daily
Pivot points : price is over resistance 1
Type : Neutral
Timeframe : Daily
Pivot points : price is over resistance 1
Type : Neutral
Timeframe : Weekly
Price is back under the pivot point
Type : Bearish
Timeframe : Daily
No signals are given by Central Patterns, a market scanner specialised in chart patterns, resistances and supports.
The Central Candlesticks scanner, specialised in Japanese candlesticks, did not identify any signals.
| S3 | S2 | S1 | Price | |
|---|---|---|---|---|
| ProTrendLines | 0.013790 | 0.019310 | 0.025700 | 0.026570 |
| Change (%) | -48.10% | -27.32% | -3.27% | - |
| Change | -0.012780 | -0.007260 | -0.000870 | - |
| Level | Major | Minor | Major | - |
Pivot points can also be used to set your price objectives. Here is the price situation in relation to pivot points:
| Pivot points | S3 | S2 | S1 | PP | R1 | R2 | R3 |
|---|---|---|---|---|---|---|---|
| Standard | 0.018070 | 0.020210 | 0.022060 | 0.024200 | 0.026050 | 0.028190 | 0.030040 |
| Camarilla | 0.022813 | 0.023179 | 0.023544 | 0.023910 | 0.024276 | 0.024642 | 0.025007 |
| Woodie | 0.017925 | 0.020138 | 0.021915 | 0.024128 | 0.025905 | 0.028118 | 0.029895 |
| Fibonacci | 0.020210 | 0.021734 | 0.022676 | 0.024200 | 0.025724 | 0.026666 | 0.028190 |
| Pivot points | S3 | S2 | S1 | PP | R1 | R2 | R3 |
|---|---|---|---|---|---|---|---|
| Standard | 0.008533 | 0.013387 | 0.017593 | 0.022447 | 0.026653 | 0.031507 | 0.035713 |
| Camarilla | 0.019309 | 0.020139 | 0.020970 | 0.021800 | 0.022631 | 0.023461 | 0.024292 |
| Woodie | 0.008210 | 0.013225 | 0.017270 | 0.022285 | 0.026330 | 0.031345 | 0.035390 |
| Fibonacci | 0.013387 | 0.016848 | 0.018986 | 0.022447 | 0.025908 | 0.028046 | 0.031507 |
| Pivot points | S3 | S2 | S1 | PP | R1 | R2 | R3 |
|---|---|---|---|---|---|---|---|
| Standard | -0.002518 | 0.001667 | 0.005879 | 0.010064 | 0.014276 | 0.018461 | 0.022673 |
| Camarilla | 0.007781 | 0.008551 | 0.009320 | 0.010090 | 0.010860 | 0.011630 | 0.012399 |
| Woodie | -0.002506 | 0.001674 | 0.005892 | 0.010071 | 0.014289 | 0.018468 | 0.022686 |
| Fibonacci | 0.001667 | 0.004875 | 0.006857 | 0.010064 | 0.013272 | 0.015254 | 0.018461 |
Numerical data
The following are the details of the technical indicators and moving averages that were collected to generate this technical analysis:
| RSI (14): | 65.31 | |
| MACD (12,26,9): | 0.0035 | |
| Directional Movement: | 16.084485 | |
| AROON (14): | 78.571426 | |
| DEMA (21): | 0.025389 | |
| Parabolic SAR (0,02-0,02-0,2): | 0.018866 | |
| Elder Ray (13): | 0.003015 | |
| Super Trend (3,10): | 0.015332 | |
| Zig ZAG (10): | 0.026570 | |
| VORTEX (21): | 1.1584 | |
| Stochastique (14,3,5): | 77.36 | |
| TEMA (21): | 0.026674 | |
| Williams %R (14): | -15.97 | |
| Chande Momentum Oscillator (20): | 0.000880 | |
| Repulse (5,40,3): | 8.0181 | |
| ROCnROLL: | 1 | |
| TRIX (15,9): | 3.3286 | |
| Courbe Coppock: | 144.76 |
| MA7: | 0.024067 | |
| MA20: | 0.020234 | |
| MA50: | 0.014294 | |
| MA100: | 0.009519 | |
| MAexp7: | 0.024403 | |
| MAexp20: | 0.020876 | |
| MAexp50: | 0.015720 | |
| MAexp100: | 0.011572 | |
| Price / MA7: | +10.40% | |
| Price / MA20: | +31.31% | |
| Price / MA50: | +85.88% | |
| Price / MA100: | +179.13% | |
| Price / MAexp7: | +8.88% | |
| Price / MAexp20: | +27.28% | |
| Price / MAexp50: | +69.02% | |
| Price / MAexp100: | +129.61% |
About author

Online


Add a comment
Comments
0 comments on the analysis RESERVE RIGHTS - RSR/USDT - Daily