ENJIN COIN - ENJ/USDT - Daily - Technical analysis published on 12/04/2019 (GMT)
- 242
- 0
- Who voted?
Click here for a new analysis!
- Timeframe : Daily
- - Analysis generated on
- Status : TARGET REACHED

Summary of the analysis

Additional analysis
Quotes
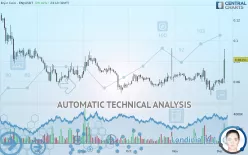
ENJIN COIN - ENJ/USDT rating 0.081510 USDT. On the day, this instrument gained +29.46% and was between 0.058710 USDT and 0.091800 USDT. This implies that the price is at +38.83% from its lowest and at -11.21% from its highest.The Central Gaps scanner detects a bullish opening marking the presence of buyers ahead of sellers at the opening but not sufficiently marked to allow the price to register a quotation gap.
Bullish opening
Type : Bullish
Timeframe : Openning
So that you have an overall view of the price change, here is a table showing the variations over several periods:
Technical
Technical analysis of this Daily chart of ENJIN COIN - ENJ/USDT indicates that the overall trend is bullish. 71.43% of the signals given by moving averages are bullish. This bullish trend is supported by the strong bullish signals given by short-term moving averages. The Central Indicators scanner detects bullish signals on moving averages that could impact this trend:
Bullish trend reversal : Moving Average 20
Type : Bullish
Timeframe : Daily
Bullish trend reversal : adaptative moving average 50
Type : Bullish
Timeframe : Daily
Bullish price crossover with Moving Average 20
Type : Bullish
Timeframe : Daily
Bullish price crossover with Moving Average 50
Type : Bullish
Timeframe : Daily
Bullish price crossover with adaptative moving average 20
Type : Bullish
Timeframe : Daily
An assessment of technical indicators shows a strong bullish signal.
Caution: the Central Indicators scanner currently detects an excess:
Williams %R indicator is overbought : over -20
Type : Neutral
Timeframe : Daily
Pivot points : price is over resistance 3
Type : Neutral
Timeframe : Daily
Pivot points : price is over resistance 3
Type : Neutral
Timeframe : Weekly
RSI indicator is back over 50
Type : Bullish
Timeframe : Daily
Momentum indicator is back over 0
Type : Bullish
Timeframe : Daily
Williams %R indicator is back over -50
Type : Bullish
Timeframe : Daily
The Central Patterns scanner, which studies chart patterns, resistances and supports, has identified these signals:
Resistance of channel is broken
Type : Bullish
Timeframe : Daily
Resistance of triangle is broken
Type : Bullish
Timeframe : Daily
Horizontal support is broken
Type : Bearish
Timeframe : Daily
Central Candlesticks, the scanner specialised in Japanese candlesticks, detects a bullish signal that could support the hypothesis of a small rebound in the very short term:
Bullish engulfing lines
Type : Bullish
Timeframe : Daily
| S1 | Price | R1 | R2 | R3 | |
|---|---|---|---|---|---|
| ProTrendLines | 0.052180 | 0.081510 | 0.082633 | 0.117233 | 0.143560 |
| Change (%) | -35.98% | - | +1.38% | +43.83% | +76.13% |
| Change | -0.029330 | - | +0.001123 | +0.035723 | +0.062050 |
| Level | Intermediate | - | Intermediate | Minor | Minor |
To determine price objectives, it is also possible to use the pivot points. Here is the price position in relation to pivot points:
| Pivot points | S3 | S2 | S1 | PP | R1 | R2 | R3 |
|---|---|---|---|---|---|---|---|
| Standard | 0.054270 | 0.056080 | 0.059520 | 0.061330 | 0.064770 | 0.066580 | 0.070020 |
| Camarilla | 0.061516 | 0.061998 | 0.062479 | 0.062960 | 0.063441 | 0.063923 | 0.064404 |
| Woodie | 0.055085 | 0.056488 | 0.060335 | 0.061738 | 0.065585 | 0.066988 | 0.070835 |
| Fibonacci | 0.056080 | 0.058086 | 0.059325 | 0.061330 | 0.063336 | 0.064575 | 0.066580 |
| Pivot points | S3 | S2 | S1 | PP | R1 | R2 | R3 |
|---|---|---|---|---|---|---|---|
| Standard | 0.035983 | 0.041437 | 0.050853 | 0.056307 | 0.065723 | 0.071177 | 0.080593 |
| Camarilla | 0.056181 | 0.057544 | 0.058907 | 0.060270 | 0.061633 | 0.062996 | 0.064359 |
| Woodie | 0.037965 | 0.042428 | 0.052835 | 0.057298 | 0.067705 | 0.072168 | 0.082575 |
| Fibonacci | 0.041437 | 0.047117 | 0.050626 | 0.056307 | 0.061987 | 0.065496 | 0.071177 |
| Pivot points | S3 | S2 | S1 | PP | R1 | R2 | R3 |
|---|---|---|---|---|---|---|---|
| Standard | 0.020543 | 0.033717 | 0.046993 | 0.060167 | 0.073443 | 0.086617 | 0.099893 |
| Camarilla | 0.052996 | 0.055421 | 0.057845 | 0.060270 | 0.062695 | 0.065119 | 0.067544 |
| Woodie | 0.020595 | 0.033743 | 0.047045 | 0.060193 | 0.073495 | 0.086643 | 0.099945 |
| Fibonacci | 0.033717 | 0.043821 | 0.050063 | 0.060167 | 0.070271 | 0.076513 | 0.086617 |
Numerical data
The following are the details of the technical indicators and moving averages that were collected to generate this technical analysis:
| RSI (14): | 68.77 | |
| MACD (12,26,9): | 0.0008 | |
| Directional Movement: | 25.594225 | |
| AROON (14): | 64.285713 | |
| DEMA (21): | 0.063034 | |
| Parabolic SAR (0,02-0,02-0,2): | 0.050293 | |
| Elder Ray (13): | 0.012122 | |
| Super Trend (3,10): | 0.050576 | |
| Zig ZAG (10): | 0.081200 | |
| VORTEX (21): | 0.9853 | |
| Stochastique (14,3,5): | 60.67 | |
| TEMA (21): | 0.064485 | |
| Williams %R (14): | -24.07 | |
| Chande Momentum Oscillator (20): | 0.023990 | |
| Repulse (5,40,3): | 30.5651 | |
| ROCnROLL: | 1 | |
| TRIX (15,9): | -0.1971 | |
| Courbe Coppock: | 2.53 |
| MA7: | 0.063413 | |
| MA20: | 0.062116 | |
| MA50: | 0.062203 | |
| MA100: | 0.064709 | |
| MAexp7: | 0.065222 | |
| MAexp20: | 0.062537 | |
| MAexp50: | 0.063027 | |
| MAexp100: | 0.068673 | |
| Price / MA7: | +28.54% | |
| Price / MA20: | +31.22% | |
| Price / MA50: | +31.04% | |
| Price / MA100: | +25.96% | |
| Price / MAexp7: | +24.97% | |
| Price / MAexp20: | +30.34% | |
| Price / MAexp50: | +29.33% | |
| Price / MAexp100: | +18.69% |
About author

Online


Add a comment
Comments
0 comments on the analysis ENJIN COIN - ENJ/USDT - Daily