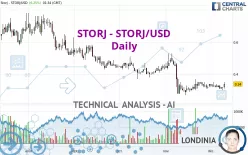
STORJ - STORJ/USD - Daily - Technical analysis published on 12/10/2022 (GMT)
- 150
- 0
Click here for a new analysis!
- Timeframe : Daily
- - Analysis generated on
- Status : TARGET REACHED

Summary of the analysis

Additional analysis
Quotes
STORJ - STORJ/USD rating 0.340000 USD. The price registered an increase of +6.25% on the session and was traded between 0.310000 USD and 0.350000 USD over the period. The price is currently at +9.68% from its lowest and -2.86% from its highest.A study of price movements over other periods shows the following variations:
Technical
A technical analysis in Daily of this STORJ - STORJ/USD chart shows a bearish trend. The signals given by moving averages are 71.43% bearish. This bearish trend could slow down given the neutral signals currently being given by short-term moving averages. The Central Indicators scanner detects a bullish signal on moving averages that could impact this trend:
Bullish price crossover with Moving Average 20
Type : Bullish
Timeframe : Daily
In fact, 10 technical indicators on 18 studied are currently bullish. Other results related to technical indicators were also found by the Central Indicators scanner:
Pivot points : price is over resistance 2
Type : Neutral
Timeframe : Daily
Pivot points : price is under support 3
Type : Neutral
Timeframe : Daily
RSI indicator is back over 50
Type : Bullish
Timeframe : Daily
Ichimoku - Bearish crossover : Tenkan & Kijun
Type : Bearish
Timeframe : Daily
Momentum indicator is back over 0
Type : Bullish
Timeframe : Daily
Williams %R indicator is back over -50
Type : Bullish
Timeframe : Daily
Central Patterns, the scanner specializing in chart patterns, did not identify any signals.
The Central Candlesticks scanner, specialised in Japanese candlesticks, did not identify any signals.
| S1 | Price | R1 | R2 | R3 | |
|---|---|---|---|---|---|
| ProTrendLines | 0.280000 | 0.340000 | 0.365738 | 0.472000 | 0.604211 |
| Change (%) | -17.65% | - | +7.57% | +38.82% | +77.71% |
| Change | -0.060000 | - | +0.025738 | +0.132000 | +0.264211 |
| Level | Intermediate | - | Minor | Minor | Major |
Attention could also be paid to pivot points to set price objectives:
| Pivot points | S3 | S2 | S1 | PP | R1 | R2 | R3 |
|---|---|---|---|---|---|---|---|
| Standard | 0.286667 | 0.293333 | 0.306667 | 0.313333 | 0.326667 | 0.333333 | 0.346667 |
| Camarilla | 0.314500 | 0.316333 | 0.318167 | 0.320000 | 0.321833 | 0.323667 | 0.325500 |
| Woodie | 0.290000 | 0.295000 | 0.310000 | 0.315000 | 0.330000 | 0.335000 | 0.350000 |
| Fibonacci | 0.293333 | 0.300973 | 0.305693 | 0.313333 | 0.320973 | 0.325693 | 0.333333 |
| Pivot points | S3 | S2 | S1 | PP | R1 | R2 | R3 |
|---|---|---|---|---|---|---|---|
| Standard | 0.270000 | 0.290000 | 0.310000 | 0.330000 | 0.350000 | 0.370000 | 0.390000 |
| Camarilla | 0.319000 | 0.322667 | 0.326333 | 0.330000 | 0.333667 | 0.337333 | 0.341000 |
| Woodie | 0.270000 | 0.290000 | 0.310000 | 0.330000 | 0.350000 | 0.370000 | 0.390000 |
| Fibonacci | 0.290000 | 0.305280 | 0.314720 | 0.330000 | 0.345280 | 0.354720 | 0.370000 |
| Pivot points | S3 | S2 | S1 | PP | R1 | R2 | R3 |
|---|---|---|---|---|---|---|---|
| Standard | -0.030000 | 0.120000 | 0.230000 | 0.380000 | 0.490000 | 0.640000 | 0.750000 |
| Camarilla | 0.268500 | 0.292333 | 0.316167 | 0.340000 | 0.363833 | 0.387667 | 0.411500 |
| Woodie | -0.050000 | 0.110000 | 0.210000 | 0.370000 | 0.470000 | 0.630000 | 0.730000 |
| Fibonacci | 0.120000 | 0.219320 | 0.280680 | 0.380000 | 0.479320 | 0.540680 | 0.640000 |
Numerical data
The following is the status of technical indicators and moving averages registered at the time this technical analysis was created:
| RSI (14): | 48.03 | |
| MACD (12,26,9): | -0.0090 | |
| Directional Movement: | 7.284915 | |
| AROON (14): | -85.714286 | |
| DEMA (21): | 0.315848 | |
| Parabolic SAR (0,02-0,02-0,2): | 0.280550 | |
| Elder Ray (13): | 0.003184 | |
| Super Trend (3,10): | 0.375905 | |
| Zig ZAG (10): | 0.340000 | |
| VORTEX (21): | 1.0196 | |
| Stochastique (14,3,5): | 48.33 | |
| TEMA (21): | 0.325904 | |
| Williams %R (14): | -20.00 | |
| Chande Momentum Oscillator (20): | 0.020000 | |
| Repulse (5,40,3): | 10.3717 | |
| ROCnROLL: | -1 | |
| TRIX (15,9): | -0.4567 | |
| Courbe Coppock: | 5.07 |
| MA7: | 0.324286 | |
| MA20: | 0.330500 | |
| MA50: | 0.362800 | |
| MA100: | 0.417200 | |
| MAexp7: | 0.326801 | |
| MAexp20: | 0.329902 | |
| MAexp50: | 0.360467 | |
| MAexp100: | 0.421938 | |
| Price / MA7: | +4.85% | |
| Price / MA20: | +2.87% | |
| Price / MA50: | -6.28% | |
| Price / MA100: | -18.50% | |
| Price / MAexp7: | +4.04% | |
| Price / MAexp20: | +3.06% | |
| Price / MAexp50: | -5.68% | |
| Price / MAexp100: | -19.42% |
About author
Online


Add a comment
Comments
0 comments on the analysis STORJ - STORJ/USD - Daily