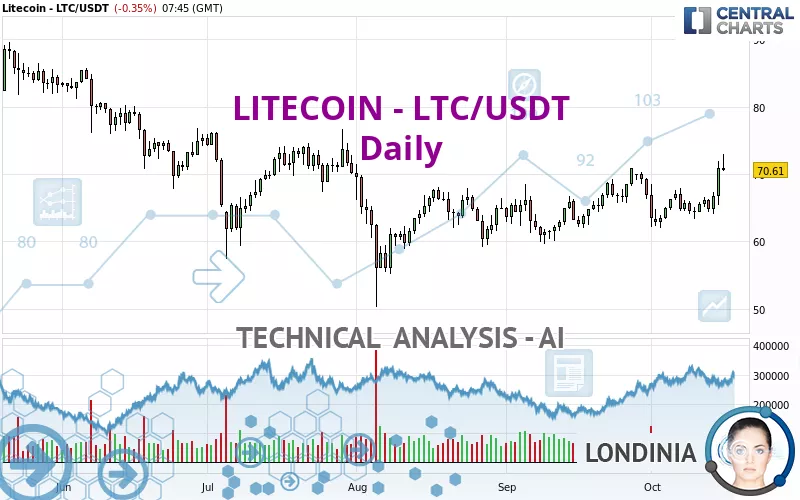
LITECOIN - LTC/USDT - Daily - Technical analysis published on 10/16/2024 (GMT)
- 117
- 0
Click here for a new analysis!
- Timeframe : Daily
- - Analysis generated on
- Status : INVALID

Summary of the analysis

Additional analysis
Quotes
LITECOIN - LTC/USDT rating 70.61 USDT. On the day, this instrument lost -0.35% and was between 70.48 USDT and 73.00 USDT. This implies that the price is at +0.18% from its lowest and at -3.27% from its highest.A bearish opening was detected by the Central Gaps scanner. Sellers are trying to impose a bearish trend in the very short term.
Bearish opening
Type : Bearish
Timeframe : Openning
Here is a more detailed summary of the historical variations registered by LITECOIN - LTC/USDT:
New HIGH record (1st january)
Type : Bullish
Timeframe : Weekly
New HIGH record (1 month)
Type : Bullish
Timeframe : Weekly
Technical
Technical analysis of LITECOIN - LTC/USDT in Daily shows a strongly overall bullish trend. 82.14% of the signals given by moving averages are bullish. The overall trend is supported by the strong bullish signals from short-term moving averages. The Central Indicators market scanner is currently detecting a bullish signal that could impact this trend:
Bullish trend reversal : adaptative moving average 100
Type : Bullish
Timeframe : Daily
In fact, according to the parameters integrated into the Central Analyzer system, 16 technical indicators out of 18 analysed are currently bullish. But beware of excesses. The Central Indicators scanner currently detects this:
CCI indicator is overbought : over 100
Type : Neutral
Timeframe : Daily
RSI indicator: bearish divergence
Type : Bearish
Timeframe : Daily
Williams %R indicator is overbought : over -20
Type : Neutral
Timeframe : Daily
Pivot points : price is over resistance 2
Type : Neutral
Timeframe : Weekly
Central Patterns, the market scanner focusing on chart patterns, resistances and supports found this result:
Resistance of channel is broken
Type : Bullish
Timeframe : Daily
Central Candlesticks, the scanner specialised in Japanese candlesticks, detects these signals that could have an impact on the current short-term trend:
Black gravestone / inverted hammer
Type : Bearish
Timeframe : Daily
Bearish harami
Type : Bearish
Timeframe : Daily
Doji
Type : Neutral
Timeframe : Daily
| S3 | S2 | S1 | Price | R1 | R2 | R3 | |
|---|---|---|---|---|---|---|---|
| ProTrendLines | 59.00 | 62.91 | 67.20 | 70.61 | 73.88 | 78.56 | 88.65 |
| Change (%) | -16.44% | -10.90% | -4.83% | - | +4.63% | +11.26% | +25.55% |
| Change | -11.61 | -7.70 | -3.41 | - | +3.27 | +7.95 | +18.04 |
| Level | Major | Intermediate | Major | - | Minor | Intermediate | Intermediate |
Attention could also be paid to pivot points to set price objectives:
| Pivot points | S3 | S2 | S1 | PP | R1 | R2 | R3 |
|---|---|---|---|---|---|---|---|
| Standard | 60.25 | 62.81 | 66.84 | 69.40 | 73.43 | 75.99 | 80.02 |
| Camarilla | 69.05 | 69.65 | 70.26 | 70.86 | 71.46 | 72.07 | 72.67 |
| Woodie | 60.98 | 63.18 | 67.57 | 69.77 | 74.16 | 76.36 | 80.75 |
| Fibonacci | 62.81 | 65.33 | 66.89 | 69.40 | 71.92 | 73.48 | 75.99 |
| Pivot points | S3 | S2 | S1 | PP | R1 | R2 | R3 |
|---|---|---|---|---|---|---|---|
| Standard | 58.95 | 61.11 | 63.65 | 65.81 | 68.35 | 70.51 | 73.05 |
| Camarilla | 64.90 | 65.33 | 65.76 | 66.19 | 66.62 | 67.05 | 67.48 |
| Woodie | 59.14 | 61.21 | 63.84 | 65.91 | 68.54 | 70.61 | 73.24 |
| Fibonacci | 61.11 | 62.91 | 64.02 | 65.81 | 67.61 | 68.72 | 70.51 |
| Pivot points | S3 | S2 | S1 | PP | R1 | R2 | R3 |
|---|---|---|---|---|---|---|---|
| Standard | 49.46 | 54.57 | 60.70 | 65.81 | 71.94 | 77.05 | 83.18 |
| Camarilla | 63.75 | 64.78 | 65.81 | 66.84 | 67.87 | 68.90 | 69.93 |
| Woodie | 49.98 | 54.83 | 61.22 | 66.07 | 72.46 | 77.31 | 83.70 |
| Fibonacci | 54.57 | 58.86 | 61.51 | 65.81 | 70.10 | 72.75 | 77.05 |
Numerical data
The following are the details of the technical indicators and moving averages that were collected to generate this technical analysis:
| RSI (14): | 62.74 | |
| MACD (12,26,9): | 0.7700 | |
| Directional Movement: | 16.17 | |
| AROON (14): | 92.86 | |
| DEMA (21): | 67.43 | |
| Parabolic SAR (0,02-0,02-0,2): | 62.17 | |
| Elder Ray (13): | 4.75 | |
| Super Trend (3,10): | 63.85 | |
| Zig ZAG (10): | 70.77 | |
| VORTEX (21): | 1.0700 | |
| Stochastique (14,3,5): | 80.58 | |
| TEMA (21): | 67.88 | |
| Williams %R (14): | -21.59 | |
| Chande Momentum Oscillator (20): | 5.70 | |
| Repulse (5,40,3): | 4.3800 | |
| ROCnROLL: | 1 | |
| TRIX (15,9): | 0.0600 | |
| Courbe Coppock: | 4.14 |
| MA7: | 67.01 | |
| MA20: | 66.47 | |
| MA50: | 65.25 | |
| MA100: | 66.03 | |
| MAexp7: | 67.85 | |
| MAexp20: | 66.58 | |
| MAexp50: | 66.03 | |
| MAexp100: | 67.48 | |
| Price / MA7: | +5.37% | |
| Price / MA20: | +6.23% | |
| Price / MA50: | +8.21% | |
| Price / MA100: | +6.94% | |
| Price / MAexp7: | +4.07% | |
| Price / MAexp20: | +6.05% | |
| Price / MAexp50: | +6.94% | |
| Price / MAexp100: | +4.64% |
About author

Online


Add a comment
Comments
0 comments on the analysis LITECOIN - LTC/USDT - Daily