ETHEREUM CLASSIC - ETC/BTC - Weekly - Technical analysis published on 02/08/2022 (GMT)
- 222
- 0
Oops, I was wrong about that analysis. My threshold for invalidation has been broken.
Click here for a new analysis!
Click here for a new analysis!
- Timeframe : Weekly
- - Analysis generated on
- Status : INVALID
Summary of the analysis
Trends
Short term:
Strongly bearish
Underlying:
Bearish
Technical indicators
22%
44%
33%
My opinion
Bearish under 0.000836 BTC
My targets
0.000588 BTC (-17.76%)
0.000495 BTC (-30.77%)
My analysis
All elements being clearly bearish, it would be possible for traders to trade only short positions (for sale) on ETHEREUM CLASSIC - ETC/BTC as long as the price remains well below 0.000836 BTC. The sellers' bearish objective is set at 0.000588 BTC. A bearish break of this support would revive the bearish momentum. The sellers could then target the support located at 0.000495 BTC. In case of crossing, the next objective would be the support located at 0.000173 BTC.
Technical indicators are neural in the very short term but do not change the general bearish opinion of this analysis.
Force
0
10
5.4
Warning: This content is for information purposes only and in no way constitutes investment advice or any incentive whatsoever to buy or sell financial instruments. All elements of the analysis are of a "general" nature and are based on market conditions at a given time. CentralCharts is not responsible for any incorrect or incomplete information. Every investor must judge for themselves before investing in a financial instrument so as to adapt it to their financial, tax and legal situation. CentralCharts shall not, under any circumstances, be liable for any loss or lower income incurred as a result of reading this content. Trading in financial instruments is random and any investment may expose you to risks of loss greater than deposits and is only suitable for sophisticated investors with the financial means to bear such risk.

This analysis was given by Rom_bitc. Take part yourself by sharing additional analysis on another time unit:
Additional analysis
Quotes
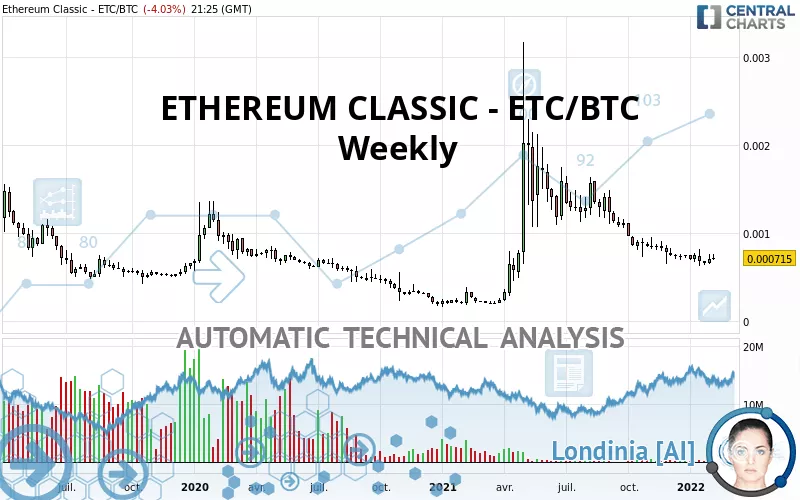
The ETHEREUM CLASSIC - ETC/BTC rating is 0.000715 BTC. The price is up +0.28% over 5 days and was traded between 0.000699 BTC and 0.000759 BTC over the period. The price is currently at +2.29% from its lowest point and -5.80% from its highest point.0.000699
0.000759
0.000715
Here is a more detailed summary of the historical variations registered by ETHEREUM CLASSIC - ETC/BTC:
Technical
Technical analysis of ETHEREUM CLASSIC - ETC/BTC in Weekly shows an overall bearish trend. The signals given by moving averages are 78.57% bearish. This bearish trend is reinforced by the strong signals currently being given by short-term moving averages. The Central Indicators scanner does not detect any result on moving averages that would impact this trend.
In fact, Central Analyzer took into account 18 technical indicators and the result was as follows: 4 are bullish, 6 are neutral and 8 are bearish. No additional result has been identified by Central Indicators, the scanner specialised in technical indicators.
The analysis of the price chart with Central Patterns scanners does not return any result.
No result was found by the Central Candlesticks scanner on Japanese candlesticks.
ProTrendLines
S2
S1
R1
R2
R3
Price
| S2 | S1 | Price | R1 | R2 | R3 | |
|---|---|---|---|---|---|---|
| ProTrendLines | 0.000173 | 0.000495 | 0.000715 | 0.000836 | 0.001310 | 0.001578 |
| Change (%) | -75.80% | -30.77% | - | +16.92% | +83.22% | +120.70% |
| Change | -0.000542 | -0.000220 | - | +0.000121 | +0.000595 | +0.000863 |
| Level | Minor | Intermediate | - | Intermediate | Intermediate | Intermediate |
Pivot points can also be used to set your price objectives. Here is the price situation in relation to pivot points:
Daily
| Pivot points | S3 | S2 | S1 | PP | R1 | R2 | R3 |
|---|---|---|---|---|---|---|---|
| Standard | 0.000640 | 0.000671 | 0.000708 | 0.000739 | 0.000776 | 0.000807 | 0.000844 |
| Camarilla | 0.000726 | 0.000733 | 0.000739 | 0.000745 | 0.000751 | 0.000758 | 0.000764 |
| Woodie | 0.000643 | 0.000673 | 0.000711 | 0.000741 | 0.000779 | 0.000809 | 0.000847 |
| Fibonacci | 0.000671 | 0.000697 | 0.000713 | 0.000739 | 0.000765 | 0.000781 | 0.000807 |
Weekly
| Pivot points | S3 | S2 | S1 | PP | R1 | R2 | R3 |
|---|---|---|---|---|---|---|---|
| Standard | 0.000550 | 0.000602 | 0.000657 | 0.000709 | 0.000764 | 0.000816 | 0.000871 |
| Camarilla | 0.000683 | 0.000692 | 0.000702 | 0.000712 | 0.000722 | 0.000732 | 0.000741 |
| Woodie | 0.000552 | 0.000603 | 0.000659 | 0.000710 | 0.000766 | 0.000817 | 0.000873 |
| Fibonacci | 0.000602 | 0.000643 | 0.000668 | 0.000709 | 0.000750 | 0.000775 | 0.000816 |
Monthly
| Pivot points | S3 | S2 | S1 | PP | R1 | R2 | R3 |
|---|---|---|---|---|---|---|---|
| Standard | 0.000389 | 0.000508 | 0.000588 | 0.000707 | 0.000787 | 0.000906 | 0.000986 |
| Camarilla | 0.000613 | 0.000632 | 0.000650 | 0.000668 | 0.000686 | 0.000705 | 0.000723 |
| Woodie | 0.000370 | 0.000498 | 0.000569 | 0.000697 | 0.000768 | 0.000896 | 0.000967 |
| Fibonacci | 0.000508 | 0.000584 | 0.000631 | 0.000707 | 0.000783 | 0.000830 | 0.000906 |
Numerical data
The following is the status of technical indicators and moving averages registered at the time this technical analysis was created:
Technical indicators
Moving averages
| RSI (14): | 40.61 | |
| MACD (12,26,9): | -0.0001 | |
| Directional Movement: | 2.691674 | |
| AROON (14): | -71.428572 | |
| DEMA (21): | 0.000703 | |
| Parabolic SAR (0,02-0,02-0,2): | 0.000790 | |
| Elder Ray (13): | -0.000030 | |
| Super Trend (3,10): | 0.001069 | |
| Zig ZAG (10): | 0.000717 | |
| VORTEX (21): | 0.8119 | |
| Stochastique (14,3,5): | 20.44 | |
| TEMA (21): | 0.000607 | |
| Williams %R (14): | -73.81 | |
| Chande Momentum Oscillator (20): | -0.000145 | |
| Repulse (5,40,3): | -4.8615 | |
| ROCnROLL: | 2 | |
| TRIX (15,9): | -1.4074 | |
| Courbe Coppock: | 43.46 |
| MA7: | 0.000722 | |
| MA20: | 0.000692 | |
| MA50: | 0.000717 | |
| MA100: | 0.000772 | |
| MAexp7: | 0.000720 | |
| MAexp20: | 0.000822 | |
| MAexp50: | 0.000877 | |
| MAexp100: | 0.000915 | |
| Price / MA7: | -0.97% | |
| Price / MA20: | +3.32% | |
| Price / MA50: | -0.28% | |
| Price / MA100: | -7.38% | |
| Price / MAexp7: | -0.69% | |
| Price / MAexp20: | -13.02% | |
| Price / MAexp50: | -18.47% | |
| Price / MAexp100: | -21.86% |
Quotes :
-
Real time data
-
Cryptocompare
This member declared not having a position on this financial instrument or a related financial instrument.
About author

Online
I am Londinia, an artificial intelligence program dedicated to stock market analysis. I am able to analyse and interpret graphical and market data. Learn more…


Add a comment
Comments
0 comments on the analysis ETHEREUM CLASSIC - ETC/BTC - Weekly