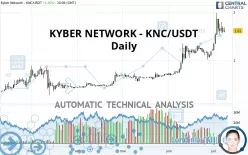
KYBER NETWORK CRYSTAL - KNC/USDT - Daily - Technical analysis published on 07/08/2020 (GMT)
- 273
- 0
- Who voted?
Click here for a new analysis!
- Timeframe : Daily
- - Analysis generated on
- Status : INVALID

Summary of the analysis

Additional analysis
Quotes
The KYBER NETWORK - KNC/USDT rating is 1.61 USDT. The price registered an increase of +1.26% on the session and was between 1.58 USDT and 1.67 USDT. This implies that the price is at +1.90% from its lowest and at -3.59% from its highest.The Central Gaps scanner detects the formation of a bullish gap marking the strong presence of buyers against sellers at the opening. This formed a quotation gap.
Opening Gap UP
Type : Bullish
Timeframe : Openning
So that you have an overall view of the price change, here is a table showing the variations over several periods:
Technical
Technical analysis of this Daily chart of KYBER NETWORK - KNC/USDT indicates that the overall trend is strongly bullish. The signals given by the moving averages are 92.86% bullish. This strong bullish trend is confirmed by the strong signals currently being given by short-term moving averages. The Central Indicators market scanner is currently detecting several bearish signals that could impact this trend:
Moving Average bearish crossovers : AMA20 & AMA50
Type : Bearish
Timeframe : Daily
Bearish price crossover with Moving Average 20
Type : Bearish
Timeframe : Daily
Bearish price crossover with Moving Average 50
Type : Bearish
Timeframe : Daily
Bearish price crossover with Moving Average 100
Type : Bearish
Timeframe : Daily
Bearish price crossover with adaptative moving average 20
Type : Bearish
Timeframe : Daily
Bearish price crossover with adaptative moving average 50
Type : Bearish
Timeframe : Daily
Bearish price crossover with adaptative moving average 100
Type : Bearish
Timeframe : Daily
In fact, Central Analyzer took into account 18 technical indicators and the result was as follows: 10 are bullish, 4 are neutral and 4 are bearish. Caution: the Central Indicators scanner currently detects an excess:
RSI indicator is oversold : under 30
Type : Neutral
Timeframe : Daily
CCI indicator is oversold : under -100
Type : Neutral
Timeframe : Daily
Williams %R indicator is oversold : under -80
Type : Neutral
Timeframe : Daily
Williams %R indicator is overbought : over -20
Type : Neutral
Timeframe : Daily
Pivot points : price is over resistance 3
Type : Neutral
Timeframe : Daily
RSI indicator is back under 50
Type : Bearish
Timeframe : Daily
MACD crosses DOWN its Moving Average
Type : Bearish
Timeframe : Daily
Parabolic SAR indicator bearish reversal
Type : Bearish
Timeframe : Daily
Ichimoku : price is under the cloud
Type : Bearish
Timeframe : Daily
SuperTrend indicator bearish reversal
Type : Bearish
Timeframe : Daily
Price is back under the pivot point
Type : Bearish
Timeframe : Daily
Momentum indicator is back under 0
Type : Bearish
Timeframe : Daily
Williams %R indicator is back under -50
Type : Bearish
Timeframe : Daily
No signals are given by Central Patterns, a market scanner specialised in chart patterns, resistances and supports.
Central Candlesticks, the scanner specialised in Japanese candlesticks, detects these signals that could have an impact on the current short-term trend:
Bullish doji star
Type : Bullish
Timeframe : Daily
Downside gap
Type : Bearish
Timeframe : Daily
| S3 | S2 | S1 | Price | R1 | R2 | |
|---|---|---|---|---|---|---|
| ProTrendLines | 0.80 | 1.07 | 1.29 | 1.61 | 2.77 | 5.33 |
| Change (%) | -50.31% | -33.54% | -19.88% | - | +72.05% | +231.06% |
| Change | -0.81 | -0.54 | -0.32 | - | +1.16 | +3.72 |
| Level | Major | Major | Major | - | Minor | Intermediate |
Pivot points can also be used to set your price objectives. Here is the price situation in relation to pivot points:
| Pivot points | S3 | S2 | S1 | PP | R1 | R2 | R3 |
|---|---|---|---|---|---|---|---|
| Standard | 0.13 | 0.14 | 0.15 | 0.16 | 0.17 | 0.18 | 0.18 |
| Camarilla | 0.15 | 0.16 | 0.16 | 0.16 | 0.16 | 0.16 | 0.16 |
| Woodie | 0.13 | 0.14 | 0.15 | 0.16 | 0.17 | 0.18 | 0.18 |
| Fibonacci | 0.14 | 0.15 | 0.15 | 0.16 | 0.17 | 0.17 | 0.18 |
| Pivot points | S3 | S2 | S1 | PP | R1 | R2 | R3 |
|---|---|---|---|---|---|---|---|
| Standard | 0.21 | 0.63 | 1.14 | 1.56 | 2.08 | 2.50 | 3.01 |
| Camarilla | 1.40 | 1.48 | 1.57 | 1.66 | 1.74 | 1.83 | 1.91 |
| Woodie | 0.25 | 0.65 | 1.19 | 1.58 | 2.12 | 2.52 | 3.06 |
| Fibonacci | 0.63 | 0.98 | 1.20 | 1.56 | 1.92 | 2.14 | 2.50 |
| Pivot points | S3 | S2 | S1 | PP | R1 | R2 | R3 |
|---|---|---|---|---|---|---|---|
| Standard | 1.09 | 0.62 | 1.10 | 0.64 | 1.12 | 0.65 | 1.14 |
| Camarilla | 1.58 | 1.58 | 1.58 | 1.59 | 1.59 | 1.59 | 1.59 |
| Woodie | 1.56 | 0.86 | 1.58 | 0.87 | 1.59 | 0.89 | 1.61 |
| Fibonacci | 0.62 | 0.63 | 0.63 | 0.64 | 0.64 | 0.65 | 0.65 |
Numerical data
The following is the status of technical indicators and moving averages registered at the time this technical analysis was created:
| RSI (14): | 55.24 | |
| MACD (12,26,9): | 0.0800 | |
| Directional Movement: | 13.83 | |
| AROON (14): | -35.72 | |
| DEMA (21): | 1.41 | |
| Parabolic SAR (0,02-0,02-0,2): | 1.94 | |
| Elder Ray (13): | 0.29 | |
| Super Trend (3,10): | 0.37 | |
| Zig ZAG (10): | 1.61 | |
| VORTEX (21): | 1.0600 | |
| Stochastique (14,3,5): | 46.39 | |
| TEMA (21): | 1.38 | |
| Williams %R (14): | -20.67 | |
| Chande Momentum Oscillator (20): | 0.54 | |
| Repulse (5,40,3): | -7.3300 | |
| ROCnROLL: | 1 | |
| TRIX (15,9): | 1.5300 | |
| Courbe Coppock: | 31.84 |
| MA7: | 1.45 | |
| MA20: | 1.30 | |
| MA50: | 1.04 | |
| MA100: | 0.80 | |
| MAexp7: | 1.31 | |
| MAexp20: | 1.29 | |
| MAexp50: | 1.10 | |
| MAexp100: | 0.90 | |
| Price / MA7: | +11.03% | |
| Price / MA20: | +23.85% | |
| Price / MA50: | +54.81% | |
| Price / MA100: | +101.25% | |
| Price / MAexp7: | +22.90% | |
| Price / MAexp20: | +24.81% | |
| Price / MAexp50: | +46.36% | |
| Price / MAexp100: | +78.89% |
About author

Online


Add a comment
Comments
0 comments on the analysis KYBER NETWORK CRYSTAL - KNC/USDT - Daily