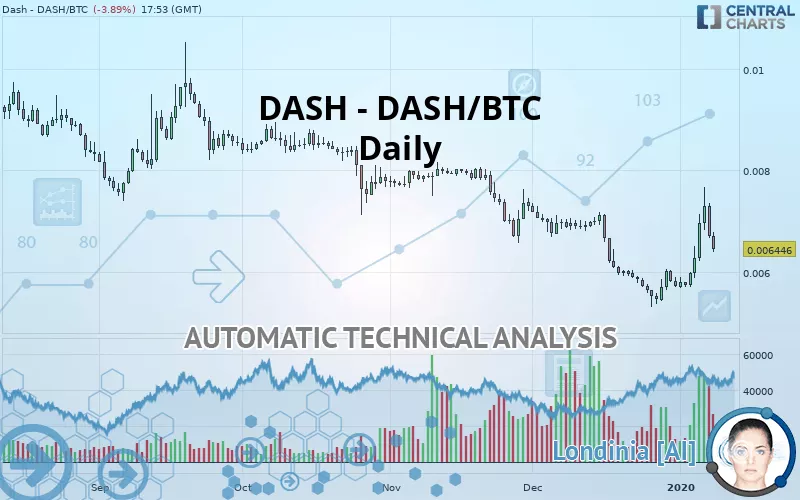
DASH - DASH/BTC - Daily - Technical analysis published on 01/08/2020 (GMT)
- 240
- 0
Click here for a new analysis!
- Timeframe : Daily
- - Analysis generated on
- Status : INVALID

Summary of the analysis

Additional analysis
Quotes
DASH - DASH/BTC rating 0.006448 BTC. On the day, this instrument lost -3.86% and was traded between 0.006404 BTC and 0.006787 BTC over the period. The price is currently at +0.69% from its lowest and -4.99% from its highest.The Central Gaps scanner detects a bearish opening. A small advantage for sellers in the very short term.
Bearish opening
Type : Bearish
Timeframe : Openning
Here is a more detailed summary of the historical variations registered by DASH - DASH/BTC:
Abnormal volumes
Timeframe : 5 days
Abnormal volumes
Timeframe : 50 days
Technical
Technical analysis of DASH - DASH/BTC in Daily shows an overall bearish trend. The signals given by moving averages are 71.43% bearish. This bearish trend could slow down given the neutral signals currently being given by short-term moving averages. There is no crossing of moving average by the price or crossing of moving averages between themselves.
An assessment of technical indicators shows a slightly bullish signal.
Caution: the Central Indicators scanner currently detects an excess:
CCI indicator is overbought : over 100
Type : Neutral
Timeframe : Daily
Previous candle closed over Bollinger bands
Type : Neutral
Timeframe : Daily
Williams %R indicator is overbought : over -20
Type : Neutral
Timeframe : Daily
Pivot points : price is under support 1
Type : Neutral
Timeframe : Daily
Ichimoku : price is under the cloud
Type : Bearish
Timeframe : Daily
MACD indicator is back over 0
Type : Bullish
Timeframe : Daily
Price is back over the pivot point
Type : Bullish
Timeframe : Weekly
The Central Patterns scanner, which studies chart patterns, resistances and supports, has identified these signals:
Near horizontal resistance
Type : Bearish
Timeframe : Daily
Resistance of channel is broken
Type : Bullish
Timeframe : Daily
For a small setback in the very short term, the Central Candlesticks scanner currently notes the presence of this bearish pattern in Japanese candlesticks:
Black evening star
Type : Bearish
Timeframe : Daily
| S1 | Price | R1 | R2 | R3 | |
|---|---|---|---|---|---|
| ProTrendLines | 0.005464 | 0.006448 | 0.007542 | 0.011692 | 0.013386 |
| Change (%) | -15.26% | - | +16.97% | +81.33% | +107.60% |
| Change | -0.000984 | - | +0.001094 | +0.005244 | +0.006938 |
| Level | Intermediate | - | Major | Minor | Minor |
Attention could also be paid to pivot points to set price objectives:
| Pivot points | S3 | S2 | S1 | PP | R1 | R2 | R3 |
|---|---|---|---|---|---|---|---|
| Standard | 0.005776 | 0.006224 | 0.006466 | 0.006914 | 0.007156 | 0.007604 | 0.007846 |
| Camarilla | 0.006517 | 0.006581 | 0.006644 | 0.006707 | 0.006770 | 0.006834 | 0.006897 |
| Woodie | 0.005672 | 0.006173 | 0.006362 | 0.006863 | 0.007052 | 0.007553 | 0.007742 |
| Fibonacci | 0.006224 | 0.006488 | 0.006651 | 0.006914 | 0.007178 | 0.007341 | 0.007604 |
| Pivot points | S3 | S2 | S1 | PP | R1 | R2 | R3 |
|---|---|---|---|---|---|---|---|
| Standard | 0.004933 | 0.005294 | 0.005783 | 0.006144 | 0.006633 | 0.006994 | 0.007483 |
| Camarilla | 0.006038 | 0.006116 | 0.006194 | 0.006272 | 0.006350 | 0.006428 | 0.006506 |
| Woodie | 0.004997 | 0.005326 | 0.005847 | 0.006176 | 0.006697 | 0.007026 | 0.007547 |
| Fibonacci | 0.005294 | 0.005619 | 0.005819 | 0.006144 | 0.006469 | 0.006669 | 0.006994 |
| Pivot points | S3 | S2 | S1 | PP | R1 | R2 | R3 |
|---|---|---|---|---|---|---|---|
| Standard | 0.002863 | 0.004088 | 0.004908 | 0.006133 | 0.006953 | 0.008178 | 0.008998 |
| Camarilla | 0.005165 | 0.005352 | 0.005540 | 0.005727 | 0.005915 | 0.006102 | 0.006289 |
| Woodie | 0.002660 | 0.003987 | 0.004705 | 0.006032 | 0.006750 | 0.008077 | 0.008795 |
| Fibonacci | 0.004088 | 0.004870 | 0.005352 | 0.006133 | 0.006915 | 0.007397 | 0.008178 |
Numerical data
The following are the details of the technical indicators and moving averages that were collected to generate this technical analysis:
| RSI (14): | 51.41 | |
| MACD (12,26,9): | 0.0000 | |
| Directional Movement: | 14.449944 | |
| AROON (14): | 78.571430 | |
| DEMA (21): | 0.006233 | |
| Parabolic SAR (0,02-0,02-0,2): | 0.005873 | |
| Elder Ray (13): | 0.000257 | |
| Super Trend (3,10): | 0.006064 | |
| Zig ZAG (10): | 0.006432 | |
| VORTEX (21): | 1.0457 | |
| Stochastique (14,3,5): | 63.91 | |
| TEMA (21): | 0.006511 | |
| Williams %R (14): | -51.87 | |
| Chande Momentum Oscillator (20): | 0.000978 | |
| Repulse (5,40,3): | -6.9768 | |
| ROCnROLL: | -1 | |
| TRIX (15,9): | -0.3631 | |
| Courbe Coppock: | 24.84 |
| MA7: | 0.006484 | |
| MA20: | 0.006030 | |
| MA50: | 0.006617 | |
| MA100: | 0.007396 | |
| MAexp7: | 0.006507 | |
| MAexp20: | 0.006299 | |
| MAexp50: | 0.006634 | |
| MAexp100: | 0.007441 | |
| Price / MA7: | -0.56% | |
| Price / MA20: | +6.93% | |
| Price / MA50: | -2.55% | |
| Price / MA100: | -12.82% | |
| Price / MAexp7: | -0.91% | |
| Price / MAexp20: | +2.37% | |
| Price / MAexp50: | -2.80% | |
| Price / MAexp100: | -13.34% |
About author

Online


Add a comment
Comments
0 comments on the analysis DASH - DASH/BTC - Daily