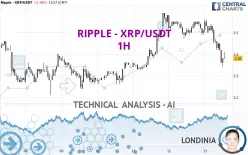
RIPPLE - XRP/USDT - 1H - Technical analysis published on 01/13/2025 (GMT)
- 216
- 0
Click here for a new analysis!
- Timeframe : 1H
- - Analysis generated on
- Status : INVALID

Summary of the analysis

Additional analysis
Quotes
The RIPPLE - XRP/USDT price is 2.38 USDT. The price registered a decrease of -5.18% on the session with the lowest point at 2.34 USDT and the highest point at 2.56 USDT. The deviation from the price is +1.71% for the low point and -7.03% for the high point.A study of price movements over other periods shows the following variations:
Near a new HIGH record (1st january)
Type : Bullish
Timeframe : Weekly
Technical
Technical analysis of RIPPLE - XRP/USDT in 1H shows an overall bearish trend. 67.86% of the signals given by moving averages are bearish. The overall trend is reinforced by the strong bearish signals from short-term moving averages. The Central Indicators scanner detects a bearish signal on moving averages that could impact this trend:
Bearish trend reversal : Moving Average 50
Type : Bearish
Timeframe : 1 hour
In fact, Central Analyzer took into account 18 technical indicators and the result was as follows: 4 are bullish, 2 are neutral and 12 are bearish. Other results related to technical indicators were also found by the Central Indicators scanner:
Pivot points : price is under support 3
Type : Neutral
Timeframe : 1 hour
Price is back under the pivot point
Type : Bearish
Timeframe : Weekly
Central Patterns, the market scanner focusing on chart patterns, resistances and supports found this result:
Resistance of channel is broken
Type : Bullish
Timeframe : 1 hour
The Central Candlesticks scanner currently notes the presence of this pattern in Japanese candlesticks that could mark the end of the short-term trend currently underway:
Doji
Type : Neutral
Timeframe : 1 hour
| S3 | S2 | S1 | Price | R1 | R2 | R3 | |
|---|---|---|---|---|---|---|---|
| ProTrendLines | 2.21 | 2.26 | 2.33 | 2.38 | 2.40 | 2.45 | 2.50 |
| Change (%) | -7.14% | -5.04% | -2.10% | - | +0.84% | +2.94% | +5.04% |
| Change | -0.17 | -0.12 | -0.05 | - | +0.02 | +0.07 | +0.12 |
| Level | Minor | Intermediate | Minor | - | Intermediate | Major | Minor |
Pivot points can also be used to set your price objectives. Here is the price situation in relation to pivot points:
| Pivot points | S3 | S2 | S1 | PP | R1 | R2 | R3 |
|---|---|---|---|---|---|---|---|
| Standard | 2.35 | 2.41 | 2.46 | 2.52 | 2.57 | 2.63 | 2.68 |
| Camarilla | 2.48 | 2.49 | 2.50 | 2.51 | 2.52 | 2.53 | 2.54 |
| Woodie | 2.35 | 2.41 | 2.46 | 2.52 | 2.57 | 2.63 | 2.68 |
| Fibonacci | 2.41 | 2.45 | 2.48 | 2.52 | 2.56 | 2.59 | 2.63 |
| Pivot points | S3 | S2 | S1 | PP | R1 | R2 | R3 |
|---|---|---|---|---|---|---|---|
| Standard | 1.95 | 2.08 | 2.33 | 2.46 | 2.71 | 2.84 | 3.09 |
| Camarilla | 2.48 | 2.51 | 2.55 | 2.58 | 2.62 | 2.65 | 2.69 |
| Woodie | 2.01 | 2.11 | 2.39 | 2.49 | 2.77 | 2.87 | 3.15 |
| Fibonacci | 2.08 | 2.23 | 2.32 | 2.46 | 2.61 | 2.70 | 2.84 |
| Pivot points | S3 | S2 | S1 | PP | R1 | R2 | R3 |
|---|---|---|---|---|---|---|---|
| Standard | 0.64 | 1.25 | 1.66 | 2.27 | 2.68 | 3.29 | 3.70 |
| Camarilla | 1.80 | 1.89 | 1.99 | 2.08 | 2.17 | 2.27 | 2.36 |
| Woodie | 0.55 | 1.20 | 1.57 | 2.22 | 2.59 | 3.24 | 3.61 |
| Fibonacci | 1.25 | 1.64 | 1.88 | 2.27 | 2.66 | 2.90 | 3.29 |
Numerical data
The following are the details of the technical indicators and moving averages that were collected to generate this technical analysis:
| RSI (14): | 36.04 | |
| MACD (12,26,9): | -0.0300 | |
| Directional Movement: | -25.18 | |
| AROON (14): | -85.72 | |
| DEMA (21): | 2.43 | |
| Parabolic SAR (0,02-0,02-0,2): | 2.50 | |
| Elder Ray (13): | -0.06 | |
| Super Trend (3,10): | 2.47 | |
| Zig ZAG (10): | 2.39 | |
| VORTEX (21): | 0.7700 | |
| Stochastique (14,3,5): | 15.15 | |
| TEMA (21): | 2.39 | |
| Williams %R (14): | -72.73 | |
| Chande Momentum Oscillator (20): | -0.13 | |
| Repulse (5,40,3): | 0.1400 | |
| ROCnROLL: | 2 | |
| TRIX (15,9): | -0.0900 | |
| Courbe Coppock: | 8.59 |
| MA7: | 2.40 | |
| MA20: | 2.31 | |
| MA50: | 2.26 | |
| MA100: | 1.47 | |
| MAexp7: | 2.42 | |
| MAexp20: | 2.46 | |
| MAexp50: | 2.47 | |
| MAexp100: | 2.44 | |
| Price / MA7: | -0.83% | |
| Price / MA20: | +3.03% | |
| Price / MA50: | +5.31% | |
| Price / MA100: | +61.90% | |
| Price / MAexp7: | -1.65% | |
| Price / MAexp20: | -3.25% | |
| Price / MAexp50: | -3.64% | |
| Price / MAexp100: | -2.46% |
About author

Online


Add a comment
Comments
0 comments on the analysis RIPPLE - XRP/USDT - 1H