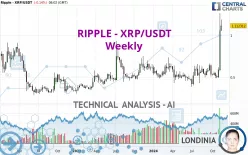
RIPPLE - XRP/USDT - Weekly - Technical analysis published on 11/19/2024 (GMT)
- 220
- 0
- Timeframe : Weekly
- - Analysis generated on
- Status : WITHOUT TARGET

Summary of the analysis
Trends
Short term:
Strongly bullish
Underlying:
Strongly bullish
Technical indicators
83%
6%
11%
My opinion
Bullish above 0.82 USDT
My targets
-
My analysis
RIPPLE - XRP/USDT is part of a very strong bullish trend. Traders may consider trading only long positions (at the time of purchase) as long as the price remains well above 0.82 USDT. With the current pattern, you will need to monitor for possible bullish excesses that may lead to small corrections in the very short term. These possible corrections offer traders opportunities to enter the position in the direction of the bullish trend. Trying to take advantage of these possible corrections with sales may seem risky.
Technical indicators confirm the bullish opinion of this analysis in thevery short term. However, be careful of excessive bullish movements. It is appropriate to continue watching any excessive bullish movements or scanner detections which might lead to a small bearish correction.
Force
0
10
8.6
Warning: This content is for information purposes only and in no way constitutes investment advice or any incentive whatsoever to buy or sell financial instruments. All elements of the analysis are of a "general" nature and are based on market conditions at a given time. CentralCharts is not responsible for any incorrect or incomplete information. Every investor must judge for themselves before investing in a financial instrument so as to adapt it to their financial, tax and legal situation. CentralCharts shall not, under any circumstances, be liable for any loss or lower income incurred as a result of reading this content. Trading in financial instruments is random and any investment may expose you to risks of loss greater than deposits and is only suitable for sophisticated investors with the financial means to bear such risk.

This analysis was given by jarias81197. Take part yourself by sharing additional analysis on another time unit:
Additional analysis
Quotes
The RIPPLE - XRP/USDT price is 1.11 USDT. Over 5 days, this instrument gained +60.94% and has been traded over the last 5 days between 0.77 USDT and 1.26 USDT. This implies that the 5 day price is +44.04% from its lowest point and -12.00% from its highest point.0.77
1.26
1.11
A study of price movements over other periods shows the following variations:
Technical
Technical analysis of RIPPLE - XRP/USDT in Weekly shows a strongly overall bullish trend. 92.86% of the signals given by moving averages are bullish. The overall trend is supported by the strong bullish signals from short-term moving averages. The Central Indicators scanner detects a bullish signal on moving averages that could impact this trend:
Bullish trend reversal : Moving Average 50
Type : Bullish
Timeframe : Weekly
Technical indicators are strongly bullish, suggesting that the price increase should continue.
But beware of excesses. The Central Indicators scanner currently detects this:
RSI indicator is overbought : over 70
Type : Neutral
Timeframe : Weekly
CCI indicator is overbought : over 100
Type : Neutral
Timeframe : Weekly
Previous candle closed over Bollinger bands
Type : Neutral
Timeframe : Weekly
The analysis of the price chart with Central Patterns scanners does not return any result.
The Central Candlesticks scanner which studies Japanese candlesticks did not detect anything.
ProTrendLines
S3
S2
S1
Price
| S3 | S2 | S1 | Price | |
|---|---|---|---|---|
| ProTrendLines | 0.42 | 0.54 | 0.82 | 1.11 |
| Change (%) | -62.21% | -51.31% | -26.29% | - |
| Change | -0.69 | -0.57 | -0.29 | - |
| Level | Major | Minor | Major | - |
To determine price objectives, it is also possible to use the pivot points. Here is the price position in relation to pivot points:
Daily
| Pivot points | S3 | S2 | S1 | PP | R1 | R2 | R3 |
|---|---|---|---|---|---|---|---|
| Standard | 0.92 | 0.99 | 1.05 | 1.12 | 1.18 | 1.25 | 1.31 |
| Camarilla | 1.08 | 1.09 | 1.10 | 1.11 | 1.13 | 1.14 | 1.15 |
| Woodie | 0.92 | 0.99 | 1.05 | 1.12 | 1.18 | 1.25 | 1.31 |
| Fibonacci | 0.99 | 1.04 | 1.07 | 1.12 | 1.17 | 1.20 | 1.25 |
Weekly
| Pivot points | S3 | S2 | S1 | PP | R1 | R2 | R3 |
|---|---|---|---|---|---|---|---|
| Standard | -0.01 | 0.27 | 0.70 | 0.98 | 1.40 | 1.69 | 2.11 |
| Camarilla | 0.93 | 0.99 | 1.06 | 1.12 | 1.19 | 1.25 | 1.32 |
| Woodie | 0.06 | 0.31 | 0.77 | 1.02 | 1.47 | 1.72 | 2.18 |
| Fibonacci | 0.27 | 0.54 | 0.71 | 0.98 | 1.25 | 1.42 | 1.69 |
Monthly
| Pivot points | S3 | S2 | S1 | PP | R1 | R2 | R3 |
|---|---|---|---|---|---|---|---|
| Standard | 0.31 | 0.40 | 0.46 | 0.54 | 0.60 | 0.69 | 0.74 |
| Camarilla | 0.47 | 0.48 | 0.50 | 0.51 | 0.52 | 0.54 | 0.55 |
| Woodie | 0.29 | 0.39 | 0.44 | 0.54 | 0.58 | 0.68 | 0.72 |
| Fibonacci | 0.40 | 0.46 | 0.49 | 0.54 | 0.60 | 0.63 | 0.69 |
Numerical data
The following are the details of the technical indicators and moving averages that were collected to generate this technical analysis:
Technical indicators
Moving averages
| RSI (14): | 76.85 | |
| MACD (12,26,9): | 0.0809 | |
| Directional Movement: | 35.63 | |
| AROON (14): | 21.43 | |
| DEMA (21): | 0.73 | |
| Parabolic SAR (0,02-0,02-0,2): | 0.50 | |
| Elder Ray (13): | 0.40 | |
| Super Trend (3,10): | 0.66 | |
| Zig ZAG (10): | 1.11 | |
| VORTEX (21): | 1.2121 | |
| Stochastique (14,3,5): | 76.16 | |
| TEMA (21): | 0.81 | |
| Williams %R (14): | -20.58 | |
| Chande Momentum Oscillator (20): | 0.56 | |
| Repulse (5,40,3): | 41.6457 | |
| ROCnROLL: | 1 | |
| TRIX (15,9): | 0.5950 | |
| Courbe Coppock: | 72.40 |
| MA7: | 0.96 | |
| MA20: | 0.70 | |
| MA50: | 0.60 | |
| MA100: | 0.59 | |
| MAexp7: | 0.80 | |
| MAexp20: | 0.65 | |
| MAexp50: | 0.59 | |
| MAexp100: | 0.56 | |
| Price / MA7: | +15.27% | |
| Price / MA20: | +59.77% | |
| Price / MA50: | +85.61% | |
| Price / MA100: | +89.34% | |
| Price / MAexp7: | +39.72% | |
| Price / MAexp20: | +70.93% | |
| Price / MAexp50: | +88.68% | |
| Price / MAexp100: | +98.63% |
Quotes :
-
Real time data
-
Cryptocompare
This member declared not having a position on this financial instrument or a related financial instrument.
About author

Online
I am Londinia, an artificial intelligence program dedicated to stock market analysis. I am able to analyse and interpret graphical and market data. Learn more…


Add a comment
Comments
0 comments on the analysis RIPPLE - XRP/USDT - Weekly