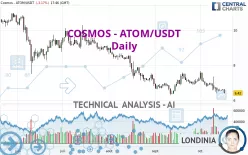
COSMOS - ATOM/USDT - Daily - Technical analysis published on 10/17/2023 (GMT)
- 241
- 0
Click here for a new analysis!
- Timeframe : Daily
- - Analysis generated on
- Status : INVALID

Summary of the analysis

Additional analysis
Quotes
COSMOS - ATOM/USDT rating 6.42 USDT. The price is lower by -3.17% since the last closing with the lowest point at 6.38 USDT and the highest point at 6.63 USDT. The deviation from the price is +0.63% for the low point and -3.17% for the high point.A study of price movements over other periods shows the following variations:
Near a new LOW record (1 year)
Type : Bearish
Timeframe : Weekly
New LOW record (1st january)
Type : Bearish
Timeframe : Weekly
New LOW record (1 month)
Type : Bearish
Timeframe : Weekly
The Central Volumes scanner detects abnormal volumes on the asset:
Abnormal volumes
Timeframe : 20 days
Technical
Technical analysis of this Daily chart of COSMOS - ATOM/USDT indicates that the overall trend is strongly bearish. 92.86% of the signals given by moving averages are bearish. This strongly bearish trend is supported by the strong bearish signals given by short-term moving averages. There is no crossing of moving average by the price or crossing of moving averages between themselves.
The probability of a further decline is moderate given the direction of the technical indicators.
Caution: the Central Indicators scanner currently detects an excess:
CCI indicator is oversold : under -100
Type : Neutral
Timeframe : Daily
Williams %R indicator is oversold : under -80
Type : Neutral
Timeframe : Daily
Pivot points : price is under support 3
Type : Neutral
Timeframe : Daily
Central Patterns, the scanner specializing in chart patterns, did not identify any signals.
No result was found by the Central Candlesticks scanner on Japanese candlesticks.
| S1 | Price | R1 | R2 | R3 | |
|---|---|---|---|---|---|
| ProTrendLines | 6.38 | 6.42 | 7.55 | 8.36 | 9.92 |
| Change (%) | -0.62% | - | +17.60% | +30.22% | +54.52% |
| Change | -0.04 | - | +1.13 | +1.94 | +3.50 |
| Level | Major | - | Intermediate | Minor | Intermediate |
To determine price objectives, it is also possible to use the pivot points. Here is the price position in relation to pivot points:
| Pivot points | S3 | S2 | S1 | PP | R1 | R2 | R3 |
|---|---|---|---|---|---|---|---|
| Standard | 6.49 | 6.54 | 6.58 | 6.63 | 6.67 | 6.72 | 6.76 |
| Camarilla | 6.61 | 6.61 | 6.62 | 6.63 | 6.64 | 6.65 | 6.66 |
| Woodie | 6.50 | 6.54 | 6.59 | 6.63 | 6.68 | 6.72 | 6.77 |
| Fibonacci | 6.54 | 6.57 | 6.59 | 6.63 | 6.66 | 6.68 | 6.72 |
| Pivot points | S3 | S2 | S1 | PP | R1 | R2 | R3 |
|---|---|---|---|---|---|---|---|
| Standard | 5.24 | 5.81 | 6.20 | 6.77 | 7.16 | 7.73 | 8.12 |
| Camarilla | 6.32 | 6.40 | 6.49 | 6.58 | 6.67 | 6.76 | 6.84 |
| Woodie | 5.14 | 5.77 | 6.10 | 6.73 | 7.06 | 7.69 | 8.02 |
| Fibonacci | 5.81 | 6.18 | 6.41 | 6.77 | 7.14 | 7.37 | 7.73 |
| Pivot points | S3 | S2 | S1 | PP | R1 | R2 | R3 |
|---|---|---|---|---|---|---|---|
| Standard | 5.20 | 5.75 | 6.49 | 7.04 | 7.78 | 8.33 | 9.07 |
| Camarilla | 6.89 | 7.00 | 7.12 | 7.24 | 7.36 | 7.48 | 7.60 |
| Woodie | 5.31 | 5.80 | 6.60 | 7.09 | 7.89 | 8.38 | 9.18 |
| Fibonacci | 5.75 | 6.24 | 6.54 | 7.04 | 7.53 | 7.83 | 8.33 |
Numerical data
The following are the details of the technical indicators and moving averages that were collected to generate this technical analysis:
| RSI (14): | 34.20 | |
| MACD (12,26,9): | -0.1500 | |
| Directional Movement: | -6.29 | |
| AROON (14): | -50.00 | |
| DEMA (21): | 6.60 | |
| Parabolic SAR (0,02-0,02-0,2): | 6.96 | |
| Elder Ray (13): | -0.19 | |
| Super Trend (3,10): | 7.20 | |
| Zig ZAG (10): | 6.43 | |
| VORTEX (21): | 0.9100 | |
| Stochastique (14,3,5): | 15.18 | |
| TEMA (21): | 6.54 | |
| Williams %R (14): | -95.53 | |
| Chande Momentum Oscillator (20): | -0.40 | |
| Repulse (5,40,3): | -4.4000 | |
| ROCnROLL: | 2 | |
| TRIX (15,9): | -0.2000 | |
| Courbe Coppock: | 14.44 |
| MA7: | 6.58 | |
| MA20: | 6.87 | |
| MA50: | 6.91 | |
| MA100: | 7.73 | |
| MAexp7: | 6.59 | |
| MAexp20: | 6.78 | |
| MAexp50: | 7.07 | |
| MAexp100: | 7.70 | |
| Price / MA7: | -2.43% | |
| Price / MA20: | -6.55% | |
| Price / MA50: | -7.09% | |
| Price / MA100: | -16.95% | |
| Price / MAexp7: | -2.58% | |
| Price / MAexp20: | -5.31% | |
| Price / MAexp50: | -9.19% | |
| Price / MAexp100: | -16.62% |
About author

Online


Add a comment
Comments
0 comments on the analysis COSMOS - ATOM/USDT - Daily