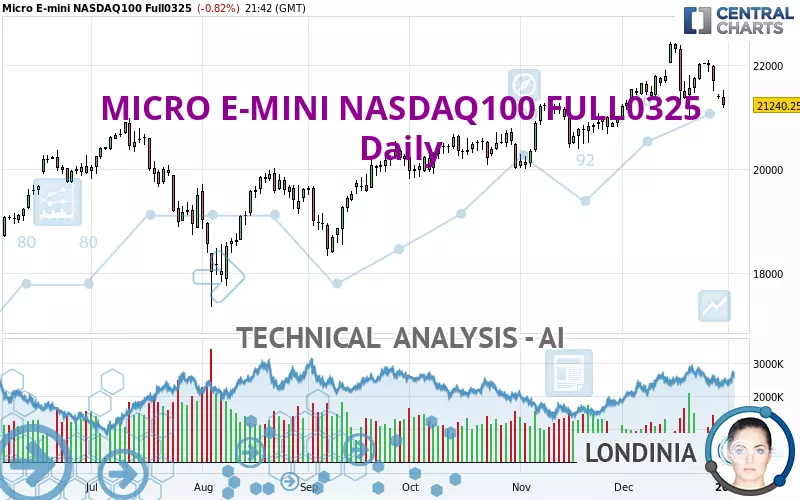
MICRO E-MINI NASDAQ100 FULL0625 - Daily - Technical analysis published on 12/31/2024 (GMT)
- 140
- 0
Click here for a new analysis!
- Timeframe : Daily
- - Analysis generated on
- Status : LEVEL MAINTAINED
Summary of the analysis

Additional analysis
Quotes
The MICRO E-MINI NASDAQ100 FULL0325 price is 21,240.25 USD. The price registered a decrease of -0.82% on the session and was traded between 21,181.75 USD and 21,524.75 USD over the period. The price is currently at +0.28% from its lowest and -1.32% from its highest.The Central Gaps scanner detects a bearish opening marking the presence of sellers ahead of buyers at the opening but not sufficiently marked to allow the price to register a quotation gap.
Bearish opening
Type : Bearish
Timeframe : Openning
A study of price movements over other periods shows the following variations:
Near a new HIGH record (5 years)
Type : Bullish
Timeframe : Weekly
Near a new HIGH record (1 year)
Type : Bullish
Timeframe : Weekly
New LOW record (1st january)
Type : Bearish
Timeframe : Weekly
Near a new HIGH record (1 month)
Type : Bullish
Timeframe : Weekly
Technical
A technical analysis in Daily of this MICRO E-MINI NASDAQ100 FULL0325 chart shows a slightly bullish trend. 57.14% of the signals given by moving averages are bullish. Caution: the strong bearish signals currently being given by short-term moving averages indicate that this slightly bullish trend could be reversed. The Central Indicators scanner detects bearish signals on moving averages that could impact this trend:
Bearish trend reversal : Moving Average 20
Type : Bearish
Timeframe : Daily
Bearish price crossover with Moving Average 50
Type : Bearish
Timeframe : Daily
Bearish price crossover with adaptative moving average 50
Type : Bearish
Timeframe : Daily
An assessment of technical indicators shows a strong bearish signal.
Caution: the Central Indicators scanner currently detects an excess:
CCI indicator is oversold : under -100
Type : Neutral
Timeframe : Daily
Williams %R indicator is oversold : under -80
Type : Neutral
Timeframe : Daily
Pivot points : price is under support 1
Type : Neutral
Timeframe : Weekly
Central Patterns, the scanner specializing in chart patterns, did not identify any signals.
The Central Candlesticks scanner, specialised in Japanese candlesticks, did not identify any signals.
| S3 | S2 | S1 | Price | R1 | R2 | |
|---|---|---|---|---|---|---|
| ProTrendLines | 18,546.45 | 19,373.75 | 20,288.12 | 21,240.25 | 21,422.00 | 22,408.00 |
| Change (%) | -12.68% | -8.79% | -4.48% | - | +0.86% | +5.50% |
| Change | -2,693.80 | -1,866.50 | -952.13 | - | +181.75 | +1,167.75 |
| Level | Major | Minor | Minor | - | Major | Major |
To determine price objectives, it is also possible to use the pivot points. Here is the price position in relation to pivot points:
| Pivot points | S3 | S2 | S1 | PP | R1 | R2 | R3 |
|---|---|---|---|---|---|---|---|
| Standard | 20,708.75 | 20,980.75 | 21,198.50 | 21,470.50 | 21,688.25 | 21,960.25 | 22,178.00 |
| Camarilla | 21,281.57 | 21,326.46 | 21,371.36 | 21,416.25 | 21,461.14 | 21,506.04 | 21,550.93 |
| Woodie | 20,681.63 | 20,967.19 | 21,171.38 | 21,456.94 | 21,661.13 | 21,946.69 | 22,150.88 |
| Fibonacci | 20,980.75 | 21,167.84 | 21,283.42 | 21,470.50 | 21,657.59 | 21,773.17 | 21,960.25 |
| Pivot points | S3 | S2 | S1 | PP | R1 | R2 | R3 |
|---|---|---|---|---|---|---|---|
| Standard | 20,777.67 | 21,126.83 | 21,412.67 | 21,761.83 | 22,047.67 | 22,396.83 | 22,682.67 |
| Camarilla | 21,523.88 | 21,582.08 | 21,640.29 | 21,698.50 | 21,756.71 | 21,814.92 | 21,873.13 |
| Woodie | 20,746.00 | 21,111.00 | 21,381.00 | 21,746.00 | 22,016.00 | 22,381.00 | 22,651.00 |
| Fibonacci | 21,126.83 | 21,369.40 | 21,519.26 | 21,761.83 | 22,004.40 | 22,154.26 | 22,396.83 |
| Pivot points | S3 | S2 | S1 | PP | R1 | R2 | R3 |
|---|---|---|---|---|---|---|---|
| Standard | 19,184.08 | 19,742.17 | 20,511.33 | 21,069.42 | 21,838.58 | 22,396.67 | 23,165.83 |
| Camarilla | 20,915.51 | 21,037.17 | 21,158.84 | 21,280.50 | 21,402.17 | 21,523.83 | 21,645.49 |
| Woodie | 19,289.63 | 19,794.94 | 20,616.88 | 21,122.19 | 21,944.13 | 22,449.44 | 23,271.38 |
| Fibonacci | 19,742.17 | 20,249.18 | 20,562.41 | 21,069.42 | 21,576.43 | 21,889.66 | 22,396.67 |
Numerical data
The following are the details of the technical indicators and moving averages that were collected to generate this technical analysis:
| RSI (14): | 42.28 | |
| MACD (12,26,9): | 57.8300 | |
| Directional Movement: | -16.93 | |
| AROON (14): | -28.57 | |
| DEMA (21): | 21,803.77 | |
| Parabolic SAR (0,02-0,02-0,2): | 22,066.84 | |
| Elder Ray (13): | -338.09 | |
| Super Trend (3,10): | 22,446.69 | |
| Zig ZAG (10): | 21,230.25 | |
| VORTEX (21): | 0.9800 | |
| Stochastique (14,3,5): | 30.57 | |
| TEMA (21): | 21,676.29 | |
| Williams %R (14): | -84.16 | |
| Chande Momentum Oscillator (20): | -848.00 | |
| Repulse (5,40,3): | -2.4600 | |
| ROCnROLL: | 2 | |
| TRIX (15,9): | 0.1100 | |
| Courbe Coppock: | 2.13 |
| MA7: | 21,740.04 | |
| MA20: | 21,822.15 | |
| MA50: | 21,356.15 | |
| MA100: | 20,787.04 | |
| MAexp7: | 21,615.93 | |
| MAexp20: | 21,675.70 | |
| MAexp50: | 21,382.73 | |
| MAexp100: | 20,947.24 | |
| Price / MA7: | -2.30% | |
| Price / MA20: | -2.67% | |
| Price / MA50: | -0.54% | |
| Price / MA100: | +2.18% | |
| Price / MAexp7: | -1.74% | |
| Price / MAexp20: | -2.01% | |
| Price / MAexp50: | -0.67% | |
| Price / MAexp100: | +1.40% |
About author

Online


Add a comment
Comments
0 comments on the analysis MICRO E-MINI NASDAQ100 FULL0625 - Daily