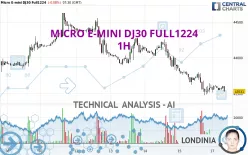
MICRO E-MINI DJ30 FULL0625 - 1H - Technical analysis published on 11/18/2024 (GMT)
- 120
- 0
Click here for a new analysis!
- Timeframe : 1H
- - Analysis generated on
- Status : LEVEL MAINTAINED

Summary of the analysis
Additional analysis
Quotes
The MICRO E-MINI DJ30 FULL1224 rating is 43,531 USD. The price registered a decrease of -0.09% on the session and was between 43,515 USD and 43,621 USD. This implies that the price is at +0.04% from its lowest and at -0.21% from its highest.The Central Gaps scanner detects a bullish opening. A small advantage for buyers in the very short term.
Bullish opening
Type : Bullish
Timeframe : Openning
So that you have an overall view of the price change, here is a table showing the variations over several periods:
Near a new HIGH record (5 years)
Type : Bullish
Timeframe : Weekly
Near a new HIGH record (1 year)
Type : Bullish
Timeframe : Weekly
Near a new HIGH record (1st january)
Type : Bullish
Timeframe : Weekly
Near a new LOW record (1 month)
Type : Bearish
Timeframe : Weekly
Technical
A technical analysis in 1H of this MICRO E-MINI DJ30 FULL1224 chart shows a sharp bearish trend. 92.86% of the signals given by moving averages are bearish. This strongly bearish trend is supported by the strong bearish signals given by short-term moving averages. The Central Indicators market scanner currently does not detect any result that concerns moving averages.
In fact, only 7 technical indicators out of 18 studied are currently positioned bearish. Central Indicators, the detector scanner for these technical indicators recently detected a signal:
Price is back under the pivot point
Type : Bearish
Timeframe : 1 hour
Central Patterns, the scanner specializing in chart patterns, did not identify any signals.
The Central Candlesticks scanner, specialised in Japanese candlesticks, did not identify any signals.
| S3 | S2 | S1 | Price | R1 | R2 | R3 | |
|---|---|---|---|---|---|---|---|
| ProTrendLines | 41,924 | 42,417 | 43,518 | 43,531 | 43,801 | 44,020 | 44,441 |
| Change (%) | -3.69% | -2.56% | -0.03% | - | +0.62% | +1.12% | +2.09% |
| Change | -1,607 | -1,114 | -13 | - | +270 | +489 | +910 |
| Level | Intermediate | Minor | Major | - | Intermediate | Major | Major |
Attention could also be paid to pivot points to set price objectives:
| Pivot points | S3 | S2 | S1 | PP | R1 | R2 | R3 |
|---|---|---|---|---|---|---|---|
| Standard | 42,964 | 43,221 | 43,394 | 43,651 | 43,824 | 44,081 | 44,254 |
| Camarilla | 43,450 | 43,489 | 43,529 | 43,568 | 43,607 | 43,647 | 43,686 |
| Woodie | 42,923 | 43,200 | 43,353 | 43,630 | 43,783 | 44,060 | 44,213 |
| Fibonacci | 43,221 | 43,385 | 43,486 | 43,651 | 43,815 | 43,916 | 44,081 |
| Pivot points | S3 | S2 | S1 | PP | R1 | R2 | R3 |
|---|---|---|---|---|---|---|---|
| Standard | 42,006 | 42,741 | 43,155 | 43,890 | 44,304 | 45,039 | 45,453 |
| Camarilla | 43,252 | 43,357 | 43,463 | 43,568 | 43,673 | 43,779 | 43,884 |
| Woodie | 41,845 | 42,661 | 42,994 | 43,810 | 44,143 | 44,959 | 45,292 |
| Fibonacci | 42,741 | 43,180 | 43,451 | 43,890 | 44,329 | 44,600 | 45,039 |
| Pivot points | S3 | S2 | S1 | PP | R1 | R2 | R3 |
|---|---|---|---|---|---|---|---|
| Standard | 39,820 | 40,846 | 41,528 | 42,554 | 43,236 | 44,262 | 44,944 |
| Camarilla | 41,739 | 41,896 | 42,052 | 42,209 | 42,366 | 42,522 | 42,679 |
| Woodie | 39,647 | 40,760 | 41,355 | 42,468 | 43,063 | 44,176 | 44,771 |
| Fibonacci | 40,846 | 41,499 | 41,902 | 42,554 | 43,207 | 43,610 | 44,262 |
Numerical data
The following is the status of technical indicators and moving averages registered at the time this technical analysis was created:
| RSI (14): | 37.00 | |
| MACD (12,26,9): | -62.0000 | |
| Directional Movement: | -13 | |
| AROON (14): | -7 | |
| DEMA (21): | 43,525 | |
| Parabolic SAR (0,02-0,02-0,2): | 43,614 | |
| Elder Ray (13): | -11 | |
| Super Trend (3,10): | 43,763 | |
| Zig ZAG (10): | 43,555 | |
| VORTEX (21): | 1.0000 | |
| Stochastique (14,3,5): | 52.00 | |
| TEMA (21): | 43,543 | |
| Williams %R (14): | -57.00 | |
| Chande Momentum Oscillator (20): | 21 | |
| Repulse (5,40,3): | 0.0000 | |
| ROCnROLL: | 2 | |
| TRIX (15,9): | 0.0000 | |
| Courbe Coppock: | 0.00 |
| MA7: | 43,969 | |
| MA20: | 43,117 | |
| MA50: | 42,751 | |
| MA100: | 41,811 | |
| MAexp7: | 43,575 | |
| MAexp20: | 43,617 | |
| MAexp50: | 43,758 | |
| MAexp100: | 43,833 | |
| Price / MA7: | -1.00% | |
| Price / MA20: | +0.96% | |
| Price / MA50: | +1.82% | |
| Price / MA100: | +4.11% | |
| Price / MAexp7: | -0.10% | |
| Price / MAexp20: | -0.20% | |
| Price / MAexp50: | -0.52% | |
| Price / MAexp100: | -0.69% |
About author

Online


Add a comment
Comments
0 comments on the analysis MICRO E-MINI DJ30 FULL0625 - 1H