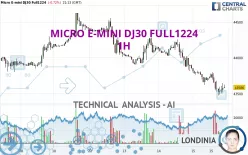
MICRO E-MINI DJ30 FULL0625 - 1H - Technical analysis published on 11/15/2024 (GMT)
- 142
- 0
Click here for a new analysis!
- Timeframe : 1H
- - Analysis generated on
- Status : TARGET REACHED

Summary of the analysis
Additional analysis
Quotes
MICRO E-MINI DJ30 FULL1224 rating 43,586 USD. The price is lower by -0.72% since the last closing and was between 43,477 USD and 43,907 USD. This implies that the price is at +0.25% from its lowest and at -0.73% from its highest.A bearish opening was detected by the Central Gaps scanner. Sellers are trying to impose a bearish trend in the very short term.
Bearish opening
Type : Bearish
Timeframe : Openning
A study of price movements over other periods shows the following variations:
New HIGH record (5 years)
Type : Bullish
Timeframe : Weekly
Near a new HIGH record (1 year)
Type : Bullish
Timeframe : Weekly
Near a new HIGH record (1st january)
Type : Bullish
Timeframe : Weekly
Near a new LOW record (1 month)
Type : Bearish
Timeframe : Weekly
Technical
Technical analysis of MICRO E-MINI DJ30 FULL1224 in 1H shows a overall strongly bearish trend. The signals given by moving averages are 92.86% bearish. This strong bearish trend is confirmed by the strong signals currently being given by short-term moving averages. The Central Indicators scanner does not detect any result on moving averages that would impact this trend.
On the 18 technical indicators analysed, 5 are bullish, 6 are neutral and 7 are bearish. Central Indicators, the scanner specialised in technical indicators, has identified these signals:
Pivot points : price is under support 3
Type : Neutral
Timeframe : 1 hour
MACD crosses UP its Moving Average
Type : Bullish
Timeframe : 1 hour
Central Patterns, the scanner specializing in chart patterns, did not identify any signals.
The Central Candlesticks scanner which studies Japanese candlesticks did not detect anything.
| S3 | S2 | S1 | Price | R1 | R2 | R3 | |
|---|---|---|---|---|---|---|---|
| ProTrendLines | 41,923 | 42,417 | 43,518 | 43,586 | 44,018 | 44,266 | 44,626 |
| Change (%) | -3.82% | -2.68% | -0.16% | - | +0.99% | +1.56% | +2.39% |
| Change | -1,663 | -1,169 | -68 | - | +432 | +680 | +1,040 |
| Level | Major | Minor | Major | - | Major | Minor | Minor |
To determine price objectives, it is also possible to use the pivot points. Here is the price position in relation to pivot points:
| Pivot points | S3 | S2 | S1 | PP | R1 | R2 | R3 |
|---|---|---|---|---|---|---|---|
| Standard | 43,288 | 43,552 | 43,727 | 43,991 | 44,166 | 44,430 | 44,605 |
| Camarilla | 43,780 | 43,821 | 43,861 | 43,901 | 43,941 | 43,981 | 44,022 |
| Woodie | 43,243 | 43,530 | 43,682 | 43,969 | 44,121 | 44,408 | 44,560 |
| Fibonacci | 43,552 | 43,720 | 43,824 | 43,991 | 44,159 | 44,263 | 44,430 |
| Pivot points | S3 | S2 | S1 | PP | R1 | R2 | R3 |
|---|---|---|---|---|---|---|---|
| Standard | 40,014 | 40,903 | 42,522 | 43,411 | 45,030 | 45,919 | 47,538 |
| Camarilla | 43,451 | 43,681 | 43,911 | 44,141 | 44,371 | 44,601 | 44,831 |
| Woodie | 40,379 | 41,086 | 42,887 | 43,594 | 45,395 | 46,102 | 47,903 |
| Fibonacci | 40,903 | 41,861 | 42,453 | 43,411 | 44,369 | 44,961 | 45,919 |
| Pivot points | S3 | S2 | S1 | PP | R1 | R2 | R3 |
|---|---|---|---|---|---|---|---|
| Standard | 39,820 | 40,846 | 41,528 | 42,554 | 43,236 | 44,262 | 44,944 |
| Camarilla | 41,739 | 41,896 | 42,052 | 42,209 | 42,366 | 42,522 | 42,679 |
| Woodie | 39,647 | 40,760 | 41,355 | 42,468 | 43,063 | 44,176 | 44,771 |
| Fibonacci | 40,846 | 41,499 | 41,902 | 42,554 | 43,207 | 43,610 | 44,262 |
Numerical data
The following is the status of the technical indicators and moving averages at the time of publication of this technical analysis:
| RSI (14): | 33.00 | |
| MACD (12,26,9): | -103.0000 | |
| Directional Movement: | -14 | |
| AROON (14): | -29 | |
| DEMA (21): | 43,549 | |
| Parabolic SAR (0,02-0,02-0,2): | 43,731 | |
| Elder Ray (13): | -50 | |
| Super Trend (3,10): | 43,791 | |
| Zig ZAG (10): | 43,597 | |
| VORTEX (21): | 1.0000 | |
| Stochastique (14,3,5): | 32.00 | |
| TEMA (21): | 43,527 | |
| Williams %R (14): | -61.00 | |
| Chande Momentum Oscillator (20): | -86 | |
| Repulse (5,40,3): | 0.0000 | |
| ROCnROLL: | 2 | |
| TRIX (15,9): | 0.0000 | |
| Courbe Coppock: | 1.00 |
| MA7: | 44,024 | |
| MA20: | 43,096 | |
| MA50: | 42,704 | |
| MA100: | 41,774 | |
| MAexp7: | 43,585 | |
| MAexp20: | 43,683 | |
| MAexp50: | 43,844 | |
| MAexp100: | 43,893 | |
| Price / MA7: | -0.99% | |
| Price / MA20: | +1.14% | |
| Price / MA50: | +2.07% | |
| Price / MA100: | +4.34% | |
| Price / MAexp7: | +0.00% | |
| Price / MAexp20: | -0.22% | |
| Price / MAexp50: | -0.59% | |
| Price / MAexp100: | -0.70% |
About author

Online


Add a comment
Comments
0 comments on the analysis MICRO E-MINI DJ30 FULL0625 - 1H