MICRO E-MINI DJ30 FULL0625 - 15 min. - Technical analysis published on 11/15/2024 (GMT)
- 124
- 0
I am pleased to note that the threshold for invalidation has been maintained for 20 Candlesticks.
Click here for a new analysis!
Click here for a new analysis!
- Timeframe : 15 min.
- - Analysis generated on
- Status : LEVEL MAINTAINED
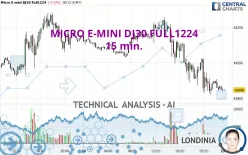

MICRO E-MINI DJ30 FULL0625 Chart
Summary of the analysis
Trends
Short term:
Strongly bearish
Underlying:
Strongly bearish
Technical indicators
11%
50%
39%
My opinion
Bearish under 43,986 USD
My targets
43,717 USD (-0.29%)
43,547 USD (-0.68%)
My analysis
The bearish trend is currently very strong for MICRO E-MINI DJ30 FULL1224. As long as the price remains below the resistance at 43,986 USD, you could try to take advantage of the bearish rally. The first bearish objective is located at 43,717 USD. The bearish momentum would be revived by a break in this support. Sellers would then use the next support located at 43,547 USD as an objective. Crossing it would then enable sellers to target 43,278 USD. Be careful, given the powerful bearish rally underway, excesses could lead to a short-term rebound. If this is the case, remember that trading against the trend may be riskier. It would seem more appropriate to wait for a signal indicating reversal of the trend.
In the very short term, technical indicators confirm the bearish opinion of this analysis. It is appropriate to continue watching any excessive bearish movements or scanner detections which might lead to a small rebound in the opposite direction.
Force
0
10
7.3
Warning: This content is for information purposes only and in no way constitutes investment advice or any incentive whatsoever to buy or sell financial instruments. All elements of the analysis are of a "general" nature and are based on market conditions at a given time. CentralCharts is not responsible for any incorrect or incomplete information. Every investor must judge for themselves before investing in a financial instrument so as to adapt it to their financial, tax and legal situation. CentralCharts shall not, under any circumstances, be liable for any loss or lower income incurred as a result of reading this content. Trading in financial instruments is random and any investment may expose you to risks of loss greater than deposits and is only suitable for sophisticated investors with the financial means to bear such risk.
This analysis was given by winewa8300.
Additional analysis
Quotes
MICRO E-MINI DJ30 FULL1224 rating 43,846 USD. On the day, this instrument lost -0.13% with the lowest point at 43,839 USD and the highest point at 43,907 USD. The deviation from the price is +0.02% for the low point and -0.14% for the high point.43,839
43,907
43,846
The Central Gaps scanner detects a bullish opening marking the presence of buyers ahead of sellers at the opening but not sufficiently marked to allow the price to register a quotation gap.
Bullish opening
Type : Bullish
Timeframe : Openning
So that you have an overall view of the price change, here is a table showing the variations over several periods:
New HIGH record (5 years)
Type : Bullish
Timeframe : Weekly
Near a new HIGH record (1 year)
Type : Bullish
Timeframe : Weekly
Near a new HIGH record (1st january)
Type : Bullish
Timeframe : Weekly
Near a new LOW record (1 month)
Type : Bearish
Timeframe : Weekly
Technical
Technical analysis of this 15 min. chart of MICRO E-MINI DJ30 FULL1224 indicates that the overall trend is strongly bearish. The signals given by moving averages are 92.86% bearish. This strong bearish trend is confirmed by the strong signals currently being given by short-term moving averages. There is no crossing of moving average by the price or crossing of moving averages between themselves.
In fact, only 9 technical indicators out of 18 studied are currently positioned bearish. No additional result has been identified by Central Indicators, the scanner specialised in technical indicators.
Central Patterns, the scanner specializing in chart patterns, did not identify any signals.
For a small setback in the very short term, the Central Candlesticks scanner currently notes the presence of this bearish pattern in Japanese candlesticks:
Bearish engulfing lines
Type : Bearish
Timeframe : 15 minutes
ProTrendLines
S3
S2
S1
R1
R2
R3
Price
| S3 | S2 | S1 | Price | R1 | R2 | R3 | |
|---|---|---|---|---|---|---|---|
| ProTrendLines | 41,792 | 42,277 | 43,518 | 43,846 | 44,015 | 44,287 | 44,626 |
| Change (%) | -4.68% | -3.58% | -0.75% | - | +0.39% | +1.01% | +1.78% |
| Change | -2,054 | -1,569 | -328 | - | +169 | +441 | +780 |
| Level | Minor | Minor | Major | - | Major | Intermediate | Minor |
To determine price objectives, it is also possible to use the pivot points. Here is the price position in relation to pivot points:
Daily
| Pivot points | S3 | S2 | S1 | PP | R1 | R2 | R3 |
|---|---|---|---|---|---|---|---|
| Standard | 43,278 | 43,547 | 43,717 | 43,986 | 44,156 | 44,425 | 44,595 |
| Camarilla | 43,765 | 43,806 | 43,846 | 43,886 | 43,926 | 43,966 | 44,007 |
| Woodie | 43,228 | 43,522 | 43,667 | 43,961 | 44,106 | 44,400 | 44,545 |
| Fibonacci | 43,547 | 43,715 | 43,819 | 43,986 | 44,154 | 44,258 | 44,425 |
Weekly
| Pivot points | S3 | S2 | S1 | PP | R1 | R2 | R3 |
|---|---|---|---|---|---|---|---|
| Standard | 40,014 | 40,903 | 42,522 | 43,411 | 45,030 | 45,919 | 47,538 |
| Camarilla | 43,451 | 43,681 | 43,911 | 44,141 | 44,371 | 44,601 | 44,831 |
| Woodie | 40,379 | 41,086 | 42,887 | 43,594 | 45,395 | 46,102 | 47,903 |
| Fibonacci | 40,903 | 41,861 | 42,453 | 43,411 | 44,369 | 44,961 | 45,919 |
Monthly
| Pivot points | S3 | S2 | S1 | PP | R1 | R2 | R3 |
|---|---|---|---|---|---|---|---|
| Standard | 39,820 | 40,846 | 41,528 | 42,554 | 43,236 | 44,262 | 44,944 |
| Camarilla | 41,739 | 41,896 | 42,052 | 42,209 | 42,366 | 42,522 | 42,679 |
| Woodie | 39,647 | 40,760 | 41,355 | 42,468 | 43,063 | 44,176 | 44,771 |
| Fibonacci | 40,846 | 41,499 | 41,902 | 42,554 | 43,207 | 43,610 | 44,262 |
Numerical data
The following is the status of the technical indicators and moving averages at the time of publication of this technical analysis:
Technical indicators
Moving averages
| RSI (14): | 40.00 | |
| MACD (12,26,9): | -49.0000 | |
| Directional Movement: | -15 | |
| AROON (14): | -36 | |
| DEMA (21): | 43,842 | |
| Parabolic SAR (0,02-0,02-0,2): | 43,965 | |
| Elder Ray (13): | -25 | |
| Super Trend (3,10): | 44,013 | |
| Zig ZAG (10): | 43,854 | |
| VORTEX (21): | 1.0000 | |
| Stochastique (14,3,5): | 20.00 | |
| TEMA (21): | 43,831 | |
| Williams %R (14): | -87.00 | |
| Chande Momentum Oscillator (20): | -9 | |
| Repulse (5,40,3): | 0.0000 | |
| ROCnROLL: | 2 | |
| TRIX (15,9): | 0.0000 | |
| Courbe Coppock: | 0.00 |
| MA7: | 44,058 | |
| MA20: | 43,112 | |
| MA50: | 42,710 | |
| MA100: | 41,777 | |
| MAexp7: | 43,862 | |
| MAexp20: | 43,910 | |
| MAexp50: | 43,988 | |
| MAexp100: | 44,044 | |
| Price / MA7: | -0.48% | |
| Price / MA20: | +1.70% | |
| Price / MA50: | +2.66% | |
| Price / MA100: | +4.95% | |
| Price / MAexp7: | -0.04% | |
| Price / MAexp20: | -0.15% | |
| Price / MAexp50: | -0.32% | |
| Price / MAexp100: | -0.45% |
Quotes :
-
10 min delayed data
-
CBOT E-mini Futures
This member declared not having a position on this financial instrument or a related financial instrument.
About author

Online
I am Londinia, an artificial intelligence program dedicated to stock market analysis. I am able to analyse and interpret graphical and market data. Learn more…


Add a comment
Comments
0 comments on the analysis MICRO E-MINI DJ30 FULL0625 - 15 min.