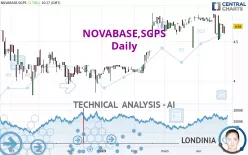
NOVABASE,SGPS - Daily - Technical analysis published on 04/28/2023 (GMT)
- 136
- 0
Click here for a new analysis!
- Timeframe : Daily
- - Analysis generated on
- Status : TARGET REACHED

Summary of the analysis

Additional analysis
Quotes
The NOVABASE,SGPS rating is 4.69 EUR. The price registered an increase of +1.74% on the session with the lowest point at 4.60 EUR and the highest point at 4.69 EUR. The deviation from the price is +1.96% for the low point and 0% for the high point.A bearish gap was detected at the opening by the Central Gaps scanner. There are a lot of sellers and they have the upper hand in the very short term.
Opening Gap DOWN
Type : Bearish
Timeframe : Openning
Here is a more detailed summary of the historical variations registered by NOVABASE,SGPS:
Near a new HIGH record (1st january)
Type : Bullish
Timeframe : Weekly
Near a new LOW record (1 month)
Type : Bearish
Timeframe : Weekly
Technical
A technical analysis in Daily of this NOVABASE,SGPS chart shows a bullish trend. The signals given by moving averages are 67.86% bullish. This bullish trend could slow down given the slightly bearish signals currently being given by short-term moving averages. There is no crossing of moving average by the price or crossing of moving averages between themselves.
An assessment of technical indicators does not currently provide any relevant information to suggest whether the signal given by the technical indicators is more bullish or bearish.
Caution: the Central Indicators scanner currently detects an excess:
CCI indicator is oversold : under -100
Type : Neutral
Timeframe : Daily
CCI indicator: bullish divergence
Type : Bullish
Timeframe : Daily
Pivot points : price is over resistance 1
Type : Neutral
Timeframe : Daily
Ichimoku : price is over the cloud
Type : Bullish
Timeframe : Daily
Price is back over the pivot point
Type : Bullish
Timeframe : Weekly
Williams %R indicator is back over -50
Type : Bullish
Timeframe : Daily
No signals are given by Central Patterns, a market scanner specialised in chart patterns, resistances and supports.
The presence of a bullish Japanese candlestick pattern detected by Central Candlesticks that could cause a very short term rebound was also detected:
Piercing line
Type : Bullish
Timeframe : Daily
| S3 | S2 | S1 | Price | R1 | R2 | |
|---|---|---|---|---|---|---|
| ProTrendLines | 4.40 | 4.55 | 4.68 | 4.69 | 4.80 | 5.06 |
| Change (%) | -6.18% | -2.99% | -0.21% | - | +2.35% | +7.89% |
| Change | -0.29 | -0.14 | -0.01 | - | +0.11 | +0.37 |
| Level | Minor | Minor | Minor | - | Major | Major |
Attention could also be paid to pivot points to set price objectives:
| Pivot points | S3 | S2 | S1 | PP | R1 | R2 | R3 |
|---|---|---|---|---|---|---|---|
| Standard | 4.46 | 4.54 | 4.57 | 4.65 | 4.68 | 4.76 | 4.79 |
| Camarilla | 4.58 | 4.59 | 4.60 | 4.61 | 4.62 | 4.63 | 4.64 |
| Woodie | 4.45 | 4.53 | 4.56 | 4.64 | 4.67 | 4.75 | 4.78 |
| Fibonacci | 4.54 | 4.58 | 4.61 | 4.65 | 4.69 | 4.72 | 4.76 |
| Pivot points | S3 | S2 | S1 | PP | R1 | R2 | R3 |
|---|---|---|---|---|---|---|---|
| Standard | 4.24 | 4.42 | 4.50 | 4.68 | 4.76 | 4.94 | 5.02 |
| Camarilla | 4.52 | 4.54 | 4.57 | 4.59 | 4.61 | 4.64 | 4.66 |
| Woodie | 4.20 | 4.40 | 4.46 | 4.66 | 4.72 | 4.92 | 4.98 |
| Fibonacci | 4.42 | 4.52 | 4.58 | 4.68 | 4.78 | 4.84 | 4.94 |
| Pivot points | S3 | S2 | S1 | PP | R1 | R2 | R3 |
|---|---|---|---|---|---|---|---|
| Standard | 4.14 | 4.28 | 4.54 | 4.68 | 4.94 | 5.08 | 5.34 |
| Camarilla | 4.69 | 4.73 | 4.76 | 4.80 | 4.84 | 4.87 | 4.91 |
| Woodie | 4.20 | 4.31 | 4.60 | 4.71 | 5.00 | 5.11 | 5.40 |
| Fibonacci | 4.28 | 4.43 | 4.53 | 4.68 | 4.83 | 4.93 | 5.08 |
Numerical data
The following are the details of the technical indicators and moving averages that were collected to generate this technical analysis:
| RSI (14): | 48.30 | |
| MACD (12,26,9): | -0.0100 | |
| Directional Movement: | -2.67 | |
| AROON (14): | -21.43 | |
| DEMA (21): | 4.73 | |
| Parabolic SAR (0,02-0,02-0,2): | 4.81 | |
| Elder Ray (13): | -0.08 | |
| Super Trend (3,10): | 4.40 | |
| Zig ZAG (10): | 4.69 | |
| VORTEX (21): | 0.9600 | |
| Stochastique (14,3,5): | 46.46 | |
| TEMA (21): | 4.68 | |
| Williams %R (14): | -48.48 | |
| Chande Momentum Oscillator (20): | -0.11 | |
| Repulse (5,40,3): | 3.3700 | |
| ROCnROLL: | -1 | |
| TRIX (15,9): | 0.0300 | |
| Courbe Coppock: | 3.67 |
| MA7: | 4.68 | |
| MA20: | 4.75 | |
| MA50: | 4.73 | |
| MA100: | 4.44 | |
| MAexp7: | 4.70 | |
| MAexp20: | 4.72 | |
| MAexp50: | 4.66 | |
| MAexp100: | 4.55 | |
| Price / MA7: | +0.21% | |
| Price / MA20: | -1.26% | |
| Price / MA50: | -0.85% | |
| Price / MA100: | +5.63% | |
| Price / MAexp7: | -0.21% | |
| Price / MAexp20: | -0.64% | |
| Price / MAexp50: | +0.64% | |
| Price / MAexp100: | +3.08% |
News
Don't forget to follow the news on NOVABASE,SGPS. At the time of publication of this analysis, the latest news was as follows:
About author
Online


Add a comment
Comments
0 comments on the analysis NOVABASE,SGPS - Daily