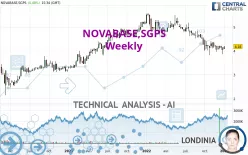
NOVABASE,SGPS - Weekly - Technical analysis published on 01/07/2023 (GMT)
- 164
- 0
Click here for a new analysis!
- Timeframe : Weekly
- - Analysis generated on
- Status : INVALID

Summary of the analysis

Additional analysis
Quotes
The NOVABASE,SGPS price is 4.18 EUR. Over 5 days, this instrument gained +3.47% with the lowest point at 4.09 EUR and the highest point at 4.19 EUR. The deviation from the price is +2.20% for the low point and -0.24% for the high point.The Central Gaps scanner detects a bearish opening. A small advantage for sellers in the very short term.
Bearish opening
Type : Bearish
Timeframe : Openning
Here is a more detailed summary of the historical variations registered by NOVABASE,SGPS:
Near a new LOW record (1st january)
Type : Bearish
Timeframe : Weekly
Near a new HIGH record (1 month)
Type : Bullish
Timeframe : Weekly
The Central Volumes scanner notes the presence of abnormal volumes:
Abnormal volumes
Timeframe : 20 days
Abnormal volumes
Timeframe : 50 days
Technical
A technical analysis in Weekly of this NOVABASE,SGPS chart shows a slightly bearish trend. Only 53.57% of the signals given by moving averages are bearish. This slightly bearish trend is reinforced by the strong signals currently being given by short-term moving averages. The Central Indicators market scanner currently does not detect any result that concerns moving averages.
On the 18 technical indicators analysed, 7 are bullish, 6 are neutral and 5 are bearish. But beware of excesses. The Central Indicators scanner currently detects this:
MACD indicator: bullish divergence
Type : Bullish
Timeframe : Weekly
Pivot points : price is over resistance 1
Type : Neutral
Timeframe : Weekly
Williams %R indicator is back over -50
Type : Bullish
Timeframe : Weekly
An analysis of the price chart with the Central Patterns scanner (detector of chart patterns and resistances and supports) shows several results that can have an impact on the price change:
Near horizontal resistance
Type : Bearish
Timeframe : Weekly
Resistance of channel is broken
Type : Bullish
Timeframe : Weekly
The Central Candlesticks scanner, specialised in Japanese candlesticks, did not identify any signals.
| S3 | S2 | S1 | Price | R1 | R2 | |
|---|---|---|---|---|---|---|
| ProTrendLines | 2.06 | 3.30 | 3.96 | 4.18 | 4.31 | 5.06 |
| Change (%) | -50.72% | -21.05% | -5.26% | - | +3.11% | +21.05% |
| Change | -2.12 | -0.88 | -0.22 | - | +0.13 | +0.88 |
| Level | Major | Intermediate | Major | - | Major | Major |
Attention could also be paid to pivot points to set price objectives:
| Pivot points | S3 | S2 | S1 | PP | R1 | R2 | R3 |
|---|---|---|---|---|---|---|---|
| Standard | 4.10 | 4.11 | 4.15 | 4.16 | 4.20 | 4.21 | 4.25 |
| Camarilla | 4.17 | 4.17 | 4.18 | 4.18 | 4.19 | 4.19 | 4.19 |
| Woodie | 4.11 | 4.12 | 4.16 | 4.17 | 4.21 | 4.22 | 4.26 |
| Fibonacci | 4.11 | 4.13 | 4.14 | 4.16 | 4.18 | 4.19 | 4.21 |
| Pivot points | S3 | S2 | S1 | PP | R1 | R2 | R3 |
|---|---|---|---|---|---|---|---|
| Standard | 3.59 | 3.72 | 3.88 | 4.01 | 4.17 | 4.30 | 4.46 |
| Camarilla | 3.96 | 3.99 | 4.01 | 4.04 | 4.07 | 4.09 | 4.12 |
| Woodie | 3.61 | 3.73 | 3.90 | 4.02 | 4.19 | 4.31 | 4.48 |
| Fibonacci | 3.72 | 3.83 | 3.90 | 4.01 | 4.12 | 4.19 | 4.30 |
| Pivot points | S3 | S2 | S1 | PP | R1 | R2 | R3 |
|---|---|---|---|---|---|---|---|
| Standard | 3.51 | 3.68 | 3.86 | 4.03 | 4.21 | 4.38 | 4.56 |
| Camarilla | 3.94 | 3.98 | 4.01 | 4.04 | 4.07 | 4.10 | 4.14 |
| Woodie | 3.52 | 3.68 | 3.87 | 4.03 | 4.22 | 4.38 | 4.57 |
| Fibonacci | 3.68 | 3.81 | 3.90 | 4.03 | 4.16 | 4.25 | 4.38 |
Numerical data
The following are the details of the technical indicators and moving averages that were collected to generate this technical analysis:
| RSI (14): | 45.31 | |
| MACD (12,26,9): | -0.1100 | |
| Directional Movement: | -13.51 | |
| AROON (14): | -28.57 | |
| DEMA (21): | 4.12 | |
| Parabolic SAR (0,02-0,02-0,2): | 4.31 | |
| Elder Ray (13): | -0.06 | |
| Super Trend (3,10): | 4.70 | |
| Zig ZAG (10): | 4.18 | |
| VORTEX (21): | 0.8700 | |
| Stochastique (14,3,5): | 40.95 | |
| TEMA (21): | 4.05 | |
| Williams %R (14): | -43.75 | |
| Chande Momentum Oscillator (20): | -0.06 | |
| Repulse (5,40,3): | 3.0400 | |
| ROCnROLL: | 2 | |
| TRIX (15,9): | -0.3500 | |
| Courbe Coppock: | 13.18 |
| MA7: | 4.11 | |
| MA20: | 4.12 | |
| MA50: | 4.14 | |
| MA100: | 4.31 | |
| MAexp7: | 4.14 | |
| MAexp20: | 4.25 | |
| MAexp50: | 4.33 | |
| MAexp100: | 4.12 | |
| Price / MA7: | +1.70% | |
| Price / MA20: | +1.46% | |
| Price / MA50: | +0.97% | |
| Price / MA100: | -3.02% | |
| Price / MAexp7: | +0.97% | |
| Price / MAexp20: | -1.65% | |
| Price / MAexp50: | -3.46% | |
| Price / MAexp100: | +1.46% |
News
Don't forget to follow the news on NOVABASE,SGPS. At the time of publication of this analysis, the latest news was as follows:
About author

Online


Add a comment
Comments
0 comments on the analysis NOVABASE,SGPS - Weekly