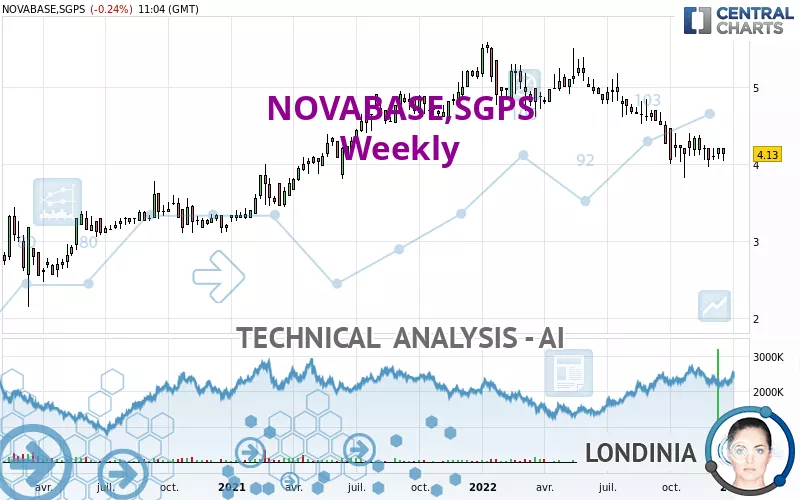
NOVABASE,SGPS - Weekly - Technical analysis published on 12/27/2022 (GMT)
- 151
- 0
Click here for a new analysis!
- Timeframe : Weekly
- - Analysis generated on
- Status : INVALID
Summary of the analysis

Additional analysis
Quotes
The NOVABASE,SGPS rating is 4.13 EUR. The price registered an increase of +2.23% over 5 days with the lowest point at 4.09 EUR and the highest point at 4.14 EUR. The deviation from the price is +0.98% for the low point and -0.24% for the high point.A study of price movements over other periods shows the following variations:
Near a new LOW record (1 month)
Type : Bearish
Timeframe : Weekly
Abnormal volumes on NOVABASE,SGPS were detected by the Central Volumes scanner:
Abnormal volumes
Timeframe : 20 days
Abnormal volumes
Timeframe : 50 days
Technical
A technical analysis in Weekly of this NOVABASE,SGPS chart shows a slightly bearish trend. Only 53.57% of the signals given by moving averages are bearish. This slightly bearish trend is reinforced by the strong signals currently being given by short-term moving averages. An assessment of moving averages reveals a bullish signal that could impact this trend:
Bullish trend reversal : adaptative moving average 100
Type : Bullish
Timeframe : Weekly
The technical indicators are generally neutral. They do not provide relevant information on the direction of future price movements.
Central Indicators, the scanner specialised in technical indicators, has identified this signal:
Price is back under the pivot point
Type : Bearish
Timeframe : Weekly
Central Patterns, the market scanner focusing on chart patterns, resistances and supports found these results:
Near resistance of channel
Type : Bearish
Timeframe : Weekly
Near resistance of triangle
Type : Bearish
Timeframe : Weekly
No result was found by the Central Candlesticks scanner on Japanese candlesticks.
| S3 | S2 | S1 | Price | R1 | R2 | |
|---|---|---|---|---|---|---|
| ProTrendLines | 2.06 | 3.30 | 4.05 | 4.13 | 4.31 | 5.06 |
| Change (%) | -50.12% | -20.10% | -1.94% | - | +4.36% | +22.52% |
| Change | -2.07 | -0.83 | -0.08 | - | +0.18 | +0.93 |
| Level | Major | Intermediate | Major | - | Major | Major |
To determine price objectives, it is also possible to use the pivot points. Here is the price position in relation to pivot points:
| Pivot points | S3 | S2 | S1 | PP | R1 | R2 | R3 |
|---|---|---|---|---|---|---|---|
| Standard | 4.05 | 4.07 | 4.10 | 4.12 | 4.15 | 4.17 | 4.20 |
| Camarilla | 4.12 | 4.12 | 4.13 | 4.13 | 4.14 | 4.14 | 4.14 |
| Woodie | 4.06 | 4.07 | 4.11 | 4.12 | 4.16 | 4.17 | 4.21 |
| Fibonacci | 4.07 | 4.09 | 4.10 | 4.12 | 4.14 | 4.15 | 4.17 |
| Pivot points | S3 | S2 | S1 | PP | R1 | R2 | R3 |
|---|---|---|---|---|---|---|---|
| Standard | 3.97 | 4.01 | 4.11 | 4.15 | 4.25 | 4.29 | 4.39 |
| Camarilla | 4.16 | 4.17 | 4.19 | 4.20 | 4.21 | 4.23 | 4.24 |
| Woodie | 3.99 | 4.03 | 4.13 | 4.17 | 4.27 | 4.31 | 4.41 |
| Fibonacci | 4.01 | 4.07 | 4.10 | 4.15 | 4.21 | 4.24 | 4.29 |
| Pivot points | S3 | S2 | S1 | PP | R1 | R2 | R3 |
|---|---|---|---|---|---|---|---|
| Standard | 3.37 | 3.67 | 3.81 | 4.11 | 4.25 | 4.55 | 4.69 |
| Camarilla | 3.84 | 3.88 | 3.92 | 3.96 | 4.00 | 4.04 | 4.08 |
| Woodie | 3.30 | 3.63 | 3.74 | 4.07 | 4.18 | 4.51 | 4.62 |
| Fibonacci | 3.67 | 3.84 | 3.94 | 4.11 | 4.28 | 4.38 | 4.55 |
Numerical data
The following are the details of the technical indicators and moving averages that were collected to generate this technical analysis:
| RSI (14): | 41.90 | |
| MACD (12,26,9): | -0.1100 | |
| Directional Movement: | -11.33 | |
| AROON (14): | -42.86 | |
| DEMA (21): | 4.15 | |
| Parabolic SAR (0,02-0,02-0,2): | 4.38 | |
| Elder Ray (13): | -0.11 | |
| Super Trend (3,10): | 4.80 | |
| Zig ZAG (10): | 4.13 | |
| VORTEX (21): | 0.8800 | |
| Stochastique (14,3,5): | 37.16 | |
| TEMA (21): | 4.07 | |
| Williams %R (14): | -63.53 | |
| Chande Momentum Oscillator (20): | -0.13 | |
| Repulse (5,40,3): | 0.2800 | |
| ROCnROLL: | 2 | |
| TRIX (15,9): | -0.3300 | |
| Courbe Coppock: | 16.43 |
| MA7: | 4.14 | |
| MA20: | 4.10 | |
| MA50: | 4.15 | |
| MA100: | 4.36 | |
| MAexp7: | 4.16 | |
| MAexp20: | 4.28 | |
| MAexp50: | 4.35 | |
| MAexp100: | 4.12 | |
| Price / MA7: | -0.24% | |
| Price / MA20: | +0.73% | |
| Price / MA50: | -0.48% | |
| Price / MA100: | -5.28% | |
| Price / MAexp7: | -0.72% | |
| Price / MAexp20: | -3.50% | |
| Price / MAexp50: | -5.06% | |
| Price / MAexp100: | +0.24% |
News
The latest news and videos published on NOVABASE,SGPS at the time of the analysis were as follows:
About author

Online


Add a comment
Comments
0 comments on the analysis NOVABASE,SGPS - Weekly