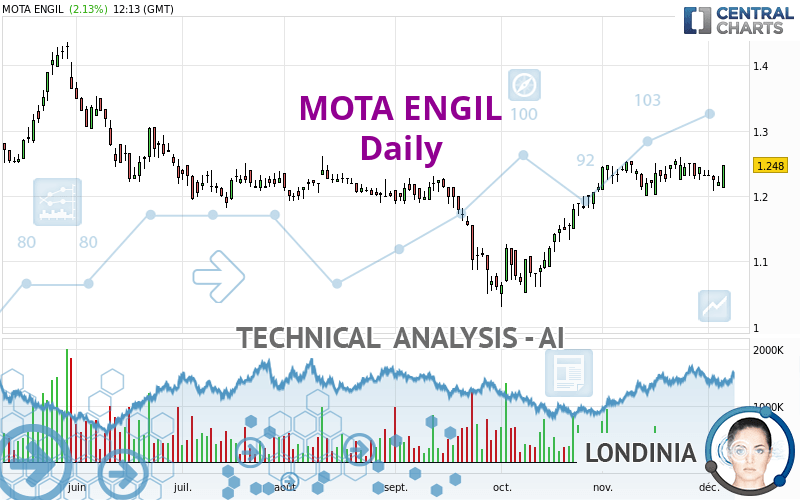
MOTA ENGIL - Daily - Technical analysis published on 12/06/2022 (GMT)
- 141
- 0
Click here for a new analysis!
- Timeframe : Daily
- - Analysis generated on
- Status : INVALID

Summary of the analysis

Additional analysis
Quotes
The MOTA ENGIL rating is 1.248 EUR. The price registered an increase of +2.13% on the session with the lowest point at 1.212 EUR and the highest point at 1.248 EUR. The deviation from the price is +2.97% for the low point and 0% for the high point.The Central Gaps scanner detects a bearish gap which is a sign that the sellers have taken the lead in the very short term.
Opening Gap DOWN
Type : Bearish
Timeframe : Openning
So that you have an overall view of the price change, here is a table showing the variations over several periods:
Near a new HIGH record (1 month)
Type : Bullish
Timeframe : Weekly
Technical
Technical analysis of this Daily chart of MOTA ENGIL indicates that the overall trend is strongly bullish. 85.71% of the signals given by moving averages are bullish. The slightly bullish signals given by the short-term moving averages indicate this trend is showing signs of running out of steam. The Central Indicators market scanner is currently detecting several bullish signals that could impact this trend:
Bullish price crossover with Moving Average 20
Type : Bullish
Timeframe : Daily
Bullish price crossover with adaptative moving average 20
Type : Bullish
Timeframe : Daily
In fact, according to the parameters integrated into the Central Analyzer system, 10 technical indicators out of 18 analysed are currently bullish. Central Indicators, the detector scanner for these technical indicators has recently detected several signals:
Pivot points : price is over resistance 1
Type : Neutral
Timeframe : Weekly
Pivot points : price is over resistance 3
Type : Neutral
Timeframe : Daily
Ichimoku - Bearish crossover : Tenkan & Kijun
Type : Bearish
Timeframe : Daily
Momentum indicator is back over 0
Type : Bullish
Timeframe : Daily
Williams %R indicator is back over -50
Type : Bullish
Timeframe : Daily
The Central Patterns scanner, which studies chart patterns, resistances and supports, has identified this signal:
Near support of channel
Type : Bullish
Timeframe : Daily
The Central Candlesticks scanner, specialised in Japanese candlesticks, did not identify any signals.
| S3 | S2 | S1 | Price | R1 | R2 | R3 | |
|---|---|---|---|---|---|---|---|
| ProTrendLines | 1.120 | 1.174 | 1.205 | 1.248 | 1.253 | 1.281 | 1.311 |
| Change (%) | -10.26% | -5.93% | -3.45% | - | +0.40% | +2.64% | +5.05% |
| Change | -0.128 | -0.074 | -0.043 | - | +0.005 | +0.033 | +0.063 |
| Level | Minor | Intermediate | Major | - | Major | Minor | Minor |
Attention could also be paid to pivot points to set price objectives:
| Pivot points | S3 | S2 | S1 | PP | R1 | R2 | R3 |
|---|---|---|---|---|---|---|---|
| Standard | 1.201 | 1.209 | 1.215 | 1.223 | 1.229 | 1.237 | 1.243 |
| Camarilla | 1.218 | 1.219 | 1.221 | 1.222 | 1.223 | 1.225 | 1.226 |
| Woodie | 1.201 | 1.209 | 1.215 | 1.223 | 1.229 | 1.237 | 1.243 |
| Fibonacci | 1.209 | 1.214 | 1.217 | 1.223 | 1.228 | 1.231 | 1.237 |
| Pivot points | S3 | S2 | S1 | PP | R1 | R2 | R3 |
|---|---|---|---|---|---|---|---|
| Standard | 1.163 | 1.185 | 1.205 | 1.227 | 1.247 | 1.269 | 1.289 |
| Camarilla | 1.213 | 1.216 | 1.220 | 1.224 | 1.228 | 1.232 | 1.236 |
| Woodie | 1.161 | 1.185 | 1.203 | 1.227 | 1.245 | 1.269 | 1.287 |
| Fibonacci | 1.185 | 1.201 | 1.211 | 1.227 | 1.243 | 1.253 | 1.269 |
| Pivot points | S3 | S2 | S1 | PP | R1 | R2 | R3 |
|---|---|---|---|---|---|---|---|
| Standard | 1.141 | 1.171 | 1.201 | 1.231 | 1.261 | 1.291 | 1.321 |
| Camarilla | 1.216 | 1.221 | 1.227 | 1.232 | 1.238 | 1.243 | 1.249 |
| Woodie | 1.142 | 1.171 | 1.202 | 1.231 | 1.262 | 1.291 | 1.322 |
| Fibonacci | 1.171 | 1.194 | 1.208 | 1.231 | 1.254 | 1.268 | 1.291 |
Numerical data
The following are the details of the technical indicators and moving averages that were collected to generate this technical analysis:
| RSI (14): | 58.78 | |
| MACD (12,26,9): | 0.0100 | |
| Directional Movement: | 2.020 | |
| AROON (14): | 35.714 | |
| DEMA (21): | 1.247 | |
| Parabolic SAR (0,02-0,02-0,2): | 1.258 | |
| Elder Ray (13): | -0.005 | |
| Super Trend (3,10): | 1.178 | |
| Zig ZAG (10): | 1.248 | |
| VORTEX (21): | 0.9150 | |
| Stochastique (14,3,5): | 49.78 | |
| TEMA (21): | 1.241 | |
| Williams %R (14): | -23.08 | |
| Chande Momentum Oscillator (20): | 0.022 | |
| Repulse (5,40,3): | 4.0970 | |
| ROCnROLL: | 1 | |
| TRIX (15,9): | 0.1870 | |
| Courbe Coppock: | 0.58 |
| MA7: | 1.233 | |
| MA20: | 1.235 | |
| MA50: | 1.182 | |
| MA100: | 1.182 | |
| MAexp7: | 1.235 | |
| MAexp20: | 1.230 | |
| MAexp50: | 1.207 | |
| MAexp100: | 1.197 | |
| Price / MA7: | +1.22% | |
| Price / MA20: | +1.05% | |
| Price / MA50: | +5.58% | |
| Price / MA100: | +5.58% | |
| Price / MAexp7: | +1.05% | |
| Price / MAexp20: | +1.46% | |
| Price / MAexp50: | +3.40% | |
| Price / MAexp100: | +4.26% |
News
The last news published on MOTA ENGIL at the time of the generation of this analysis was as follows:
- Poly Adds People Strategy Expert and HR Professional Kim Mota to Executive Team as Senior Vice President of People Experiences
-
 Mota Ventures sees strong sales increase amid COVID-10 Crisis
- Mota Raises $1.7 Million in Private Placement
- Mota Ventures Successful Immune Line Launch Signs Up Over 5,500 New Customers in 12 Days
- Mota Ventures Moves Forward with Its Acquisition of Spanish CBD Company Sativida
About author
Online


Add a comment
Comments
0 comments on the analysis MOTA ENGIL - Daily