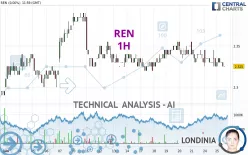
REN - 1H - Technical analysis published on 06/25/2024 (GMT)
- 127
- 0
Click here for a new analysis!
- Timeframe : 1H
- - Analysis generated on
- Status : TARGET REACHED

Summary of the analysis

Additional analysis
Quotes
The REN price is 2.325 EUR. On the day, this instrument gained +0.00% and was traded between 2.325 EUR and 2.335 EUR over the period. The price is currently at 0% from its lowest and -0.43% from its highest.Here is a more detailed summary of the historical variations registered by REN:
Near a new HIGH record (1 year)
Type : Bullish
Timeframe : Weekly
Near a new HIGH record (1st january)
Type : Bullish
Timeframe : Weekly
Near a new HIGH record (1 month)
Type : Bullish
Timeframe : Weekly
Technical
Technical analysis of this 1H chart of REN indicates that the overall trend is strongly bearish. 85.71% of the signals given by moving averages are bearish. The overall trend is supported by the strong bearish signals from short-term moving averages. The Central Indicators scanner detects a bearish signal on moving averages that could impact this trend:
Bearish price crossover with adaptative moving average 100
Type : Bearish
Timeframe : 1 hour
Technical indicators are strongly bearish, suggesting that the price decline is expected to continue.
Caution: the Central Indicators scanner currently detects an excess:
CCI indicator is oversold : under -100
Type : Neutral
Timeframe : 1 hour
Williams %R indicator is oversold : under -80
Type : Neutral
Timeframe : 1 hour
Price is back under the pivot point
Type : Bearish
Timeframe : Weekly
The analysis of the price chart with Central Patterns scanners does not return any result.
The Central Candlesticks scanner which studies Japanese candlesticks did not detect anything.
| S3 | S2 | S1 | Price | R1 | R2 | R3 | |
|---|---|---|---|---|---|---|---|
| ProTrendLines | 2.285 | 2.294 | 2.320 | 2.325 | 2.332 | 2.340 | 2.355 |
| Change (%) | -1.72% | -1.33% | -0.22% | - | +0.30% | +0.65% | +1.29% |
| Change | -0.040 | -0.031 | -0.005 | - | +0.007 | +0.015 | +0.030 |
| Level | Minor | Major | Intermediate | - | Intermediate | Intermediate | Intermediate |
Pivot points can also be used to set your price objectives. Here is the price situation in relation to pivot points:
| Pivot points | S3 | S2 | S1 | PP | R1 | R2 | R3 |
|---|---|---|---|---|---|---|---|
| Standard | 2.298 | 2.312 | 2.318 | 2.332 | 2.338 | 2.352 | 2.358 |
| Camarilla | 2.320 | 2.321 | 2.323 | 2.325 | 2.327 | 2.329 | 2.331 |
| Woodie | 2.295 | 2.310 | 2.315 | 2.330 | 2.335 | 2.350 | 2.355 |
| Fibonacci | 2.312 | 2.319 | 2.324 | 2.332 | 2.339 | 2.344 | 2.352 |
| Pivot points | S3 | S2 | S1 | PP | R1 | R2 | R3 |
|---|---|---|---|---|---|---|---|
| Standard | 2.280 | 2.300 | 2.315 | 2.335 | 2.350 | 2.370 | 2.385 |
| Camarilla | 2.320 | 2.324 | 2.327 | 2.330 | 2.333 | 2.336 | 2.340 |
| Woodie | 2.278 | 2.299 | 2.313 | 2.334 | 2.348 | 2.369 | 2.383 |
| Fibonacci | 2.300 | 2.313 | 2.322 | 2.335 | 2.348 | 2.357 | 2.370 |
| Pivot points | S3 | S2 | S1 | PP | R1 | R2 | R3 |
|---|---|---|---|---|---|---|---|
| Standard | 1.923 | 2.043 | 2.169 | 2.289 | 2.415 | 2.535 | 2.661 |
| Camarilla | 2.227 | 2.250 | 2.273 | 2.295 | 2.318 | 2.340 | 2.363 |
| Woodie | 1.926 | 2.045 | 2.172 | 2.291 | 2.418 | 2.537 | 2.664 |
| Fibonacci | 2.043 | 2.137 | 2.195 | 2.289 | 2.383 | 2.441 | 2.535 |
Numerical data
The following is the status of the technical indicators and moving averages at the time of publication of this technical analysis:
| RSI (14): | 40.72 | |
| MACD (12,26,9): | -0.0030 | |
| Directional Movement: | 8.685 | |
| AROON (14): | 0 | |
| DEMA (21): | 2.330 | |
| Parabolic SAR (0,02-0,02-0,2): | 2.342 | |
| Elder Ray (13): | -0.004 | |
| Super Trend (3,10): | 2.346 | |
| Zig ZAG (10): | 2.325 | |
| VORTEX (21): | 0.7410 | |
| Stochastique (14,3,5): | 16.67 | |
| TEMA (21): | 2.327 | |
| Williams %R (14): | -100.00 | |
| Chande Momentum Oscillator (20): | -0.005 | |
| Repulse (5,40,3): | -0.3480 | |
| ROCnROLL: | 2 | |
| TRIX (15,9): | -0.0140 | |
| Courbe Coppock: | 0.68 |
| MA7: | 2.336 | |
| MA20: | 2.332 | |
| MA50: | 2.284 | |
| MA100: | 2.202 | |
| MAexp7: | 2.330 | |
| MAexp20: | 2.333 | |
| MAexp50: | 2.336 | |
| MAexp100: | 2.338 | |
| Price / MA7: | -0.47% | |
| Price / MA20: | -0.30% | |
| Price / MA50: | +1.80% | |
| Price / MA100: | +5.59% | |
| Price / MAexp7: | -0.21% | |
| Price / MAexp20: | -0.34% | |
| Price / MAexp50: | -0.47% | |
| Price / MAexp100: | -0.56% |
News
The last news published on REN at the time of the generation of this analysis was as follows:
- ANNOUNCEMENT OF 2023 ANNUAL RESULTS OF TONG REN TANG TECHNOLOGIES
- Flash News: OKG Technology Chairman Jeff Ren Outlines the Future of Web3 at Economist Impact's Technology for Change Asia 2024
- Flash News: OKG Technology Chairman Jeff Ren to Speak at Economist Impact's Technology for Change Asia Event in Hong Kong
- Flash News: OKG Technology Chairman Jeff Ren to Speak at Economist Impact's Technology for Change Asia Event in Hong Kong
- Xinhua Silk Road: Pien Tze Huang, Beijing Tong Ren Tang agree to boost bilateral cooperation, promote high-quality development of TCM
About author
Online


Add a comment
Comments
0 comments on the analysis REN - 1H